VTL Kernel Metrics: Behavioral Drift Detection for Generative Models
Measuring Compositional Constraints in AI Image Generators Through Geometry-First Analysis
Abstract
Generative image models develop persistent compositional priors, structural arrangements that resist prompt-level control, but these priors are invisible to semantic evaluation methods. This paper introduces the Visual Thinking Lens (VTL) kernel: a seven-metric geometric measurement framework that locates generated images in a low-dimensional composition space without requiring model access, training data, or semantic interpretation. Applying the kernel to 432 images generated by Sora, MidJourney, and OpenAI's image generator across a four-condition spatial control gradient, three findings emerge. First, all three engines exhibit a consistent 13–15% snap-back in peripheral pull coordinates when prompts attempt to push outputs beyond compositional basin boundaries, revealing a measurable limit on spatial controllability. Second, prompt-induced coordinate shifts are 2.6× larger than engine-to-engine baseline differences, confirming the kernel as a behavioral response metric rather than a static bias detector. Third, signal-to-noise ratio varies substantially by engine, Sora: 4.2; MidJourney and OpenAI: 1.3, with direct implications for minimum sample sizes in regression detection pipelines. From these findings three operational applications are derived: automated model update regression detection, mode collapse quantification via a Monoculture Index, and structural anomaly flagging. The framework is deterministic, model-agnostic, and deploys entirely from rendered image output.
1. Introduction
Foundation model teams ship continuous updates to image generators, but current evaluation infrastructure contains a structural gap. Capabilities testing, instruction following, semantic coherence, safety filtering, is well-developed. What does not yet exist is a methodology for detecting whether a model update has shifted structural behavioral patterns: whether a model is generating a narrower range of compositions, distributing visual mass differently, or responding less faithfully to spatial instructions than it did in a prior version.
This gap matters for several distinct constituencies. Red teams need reproducible, quantitative tests for spatial controllability, evidence that a model's compositional behavior remains within specification across versions. Alignment researchers studying distribution shift need drift metrics that operate without model access, applicable to closed commercial systems where training data, weights, and internal representations are unavailable. Safety engineers monitoring production deployments need automated anomaly detection that does not require semantic understanding of image content.
Current evaluation approaches are insufficient for this purpose. Human review is subjective and slow. CLIP-based semantic metrics measure whether a subject is present, not where it is placed or how visual mass is organized around it. FID measures distribution distance against training data that already carries the same compositional biases as the outputs being evaluated, the benchmark is built on the bias it is supposed to detect. Aesthetic predictors learn human preferences shaped by decades of photography and social media output produced by the same default compositional templates they purport to measure. None of these approaches tracks where visual mass goes, or whether it goes to the same place across versions.
The Visual Thinking Lens (VTL) kernel addresses this gap directly. By extracting seven geometric measurements from any rendered image, horizontal and vertical mass displacement (Δx, Δy), void ratio (rᵥ), packing density (ρᵣ), peripheral pull (xₚ), structural thickness (dₛ), and orientation stability (θ), the kernel locates images in a composition space where behavioral change becomes directly observable and statistically testable, without model access, without training data, and without semantic interpretation.
This paper makes three contributions: (1) formal specification of the VTL kernel metric set with measurement rationale and individual metric definitions; (2) empirical characterization of compositional constraints in three leading image generators through a controlled spatial forcing study; and (3) operational application frameworks for regression detection, mode collapse monitoring, and structural anomaly flagging derived from empirical findings.
2. The VTL Kernel
2.1 Design Rationale
The kernel is designed around three constraints. First, it must require no model access: all measurements are extracted from final rendered output, making the framework applicable across closed commercial systems. Second, it must be geometry-first: metrics capture spatial arrangement and mass distribution rather than semantic content, aesthetic quality, or conceptual meaning, ensuring orthogonality to content-based evaluation. Third, it must be deterministic: the same image must produce identical coordinates under any compliant implementation, enabling version-controlled baselines and reproducible regression tests.
The seven metrics span the compositional structure of an image without overlap. Placement metrics (Δx, Δy) locate the centroid of visual mass. Density metrics (rᵥ, ρᵣ) characterize how mass is distributed within and across occupied regions. The boundary interaction metric (xₚ) captures pull toward frame edges. Material metrics (dₛ) measure structural weight and solidity. The directional metric (θ) quantifies coherence of orientation across the image. Together they define a low-dimensional coordinate frame in which compositional change is directly measurable.
2.2 Kernel Metric Summary
| Kernel | Name | Measures | Structural Question Answered |
|---|---|---|---|
| Δx | Horizontal Placement Offset | Normalized left–right displacement of visual mass centroid | Is the composition centered or laterally biased? |
| Δy | Vertical Placement Offset | Normalized top–bottom displacement of visual mass centroid | Is mass vertically balanced or drifting up/down? |
| rᵥ | Void Ratio | Fraction of frame with gradient magnitude below absolute threshold (τabs = 0.15) | How open vs. congested is the layout? |
| ρᵣ | Packing Density | Degree of clustering of occupied regions | Are objects compacted or spatially dispersed? |
| xₚ | Peripheral Pull (Edge Mass Ratio) | Proportion of mass within outer 15% frame band | Is the model attracted to frame edges or center-biased? |
| dₛ | Structural Thickness | Skeleton-normalized average material thickness | Are structures thin/planar or volumetrically heavy? |
| θ | Orientation Stability | Entropy-based directional coherence metric | Is structure directionally aligned or chaotic? |
Note on rᵥ: rᵥ uses an absolute gradient threshold (τabs = 0.15) while all other metrics use percentile masking (lighting-invariant). For cross-engine comparisons, interpret rᵥ alongside gradient field context. For within-engine regression detection, comparing the same engine across versions, rᵥ is valid as an absolute density signal.
2.3 Individual Metric Specifications
Δx: Horizontal Placement Offset
Measures the normalized horizontal displacement of visual mass from the image center. Captures left/right compositional bias. Sensitive to centering vs. decentering instructions. Primary driver of spatial intent along the x-axis.
Δy: Vertical Placement Offset
Measures the normalized vertical displacement of visual mass from the image center. Captures top/bottom mass bias. Detects horizon drift, vertical imbalance, or stacking behavior. Complements Δx to fully locate centroid displacement.
rᵥ: Void Ratio
Measures the proportion of frame with gradient magnitude below absolute threshold (τabs = 0.15). Indicates openness vs. congestion; responds to sparse vs. crowded layouts; discriminates texture-heavy (low rᵥ) from sparse (high rᵥ) compositions.
Reference values: rᵥ > 0.75 (sparse, open composition) · rᵥ < 0.40 (dense, cluttered composition)
ρᵣ: Packing Density
Measures how tightly visual mass is clustered within occupied regions. High values indicate compact object grouping; low values indicate spread or fragmentation. Separates structural density from simple area coverage.
xₚ: Peripheral Pull (Edge Mass Ratio)
Measures the proportion of visual mass located within the outer frame band (15% border region). Detects edge attraction vs. center bias and indicates frame-hugging behavior. Primary signal for default centering resistance and compositional attractor basin boundaries. xₚ is the most sensitive single axis for detecting snap-back behavior and regression.
dₛ: Structural Thickness
Approximates average material thickness using skeleton-to-area ratio. Captures visual weight and stroke solidity. Distinguishes thin dispersed structures from thick consolidated forms. Reflects volumetric vs. planar occupation tendencies.
θ: Orientation Stability
Entropy-based measure of directional alignment consistency across the image. High values indicate strong directional coherence; low values indicate chaotic or isotropic structure. This metric measures stability, not angle.
3. Experimental Design
3.1 Engines
Three commercial image generators were tested under standard consumer access: Sora (OpenAI), MidJourney (referred to as MJ), and OpenAI's image generator (referred to as OA). No fine-tuning, system prompts, or model internals were accessed or modified. All images were generated at default quality settings across standard consumer interfaces.
3.2 Prompt Gradient
A four-condition prompt gradient was constructed as structural forcing functions rather than creative descriptions. Each prompt is an explicit spatial control command designed to probe each engine's response range, testing what models resist doing, not what they prefer. The subject and shooting condition are held constant across all four conditions; only the spatial instruction varies.
Neutral establishes baseline structural behavior. Centered and Decentered probe directional compliance at opposite ends of the dispersion axis. Side attempts to push beyond Decentered into asymmetric placement, testing whether the model sustains the displacement or retreats toward its compositional default.
3.3 Sample Design
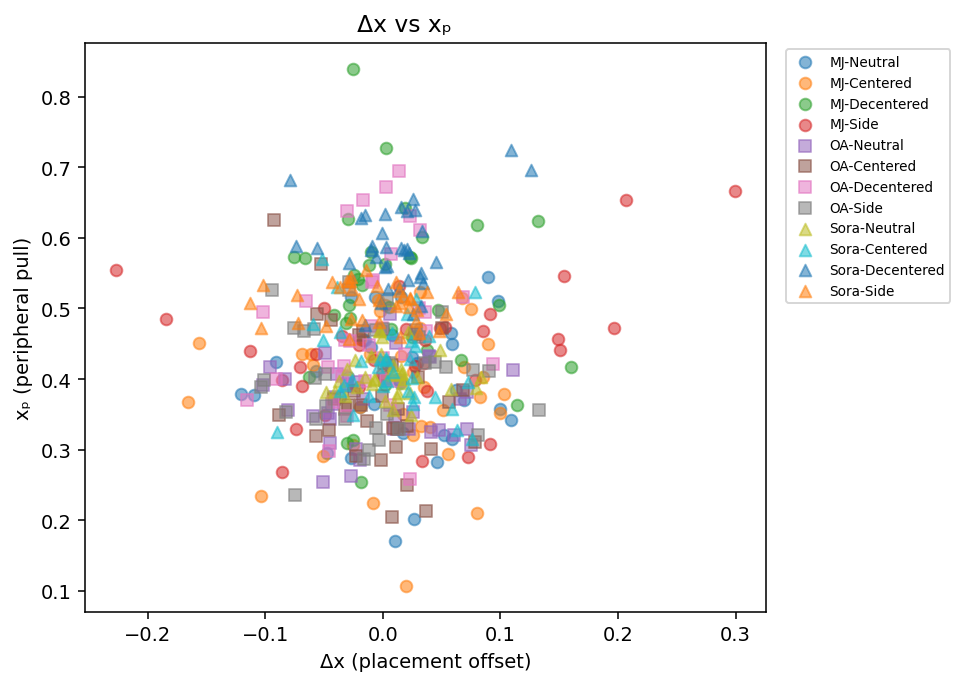
432 total images were generated: 144 per engine, 36 per prompt condition per engine. Three aspect ratios were included per engine (1:1, 2:3, 3:2) to test format invariance within each 36-image condition batch. All seven kernel metrics were extracted from each image, yielding a dataset of 3,024 metric observations. Analysis was performed on xₚ and Δx as the primary measurement axes, with remaining metrics used to characterize secondary structural properties.

4. Results
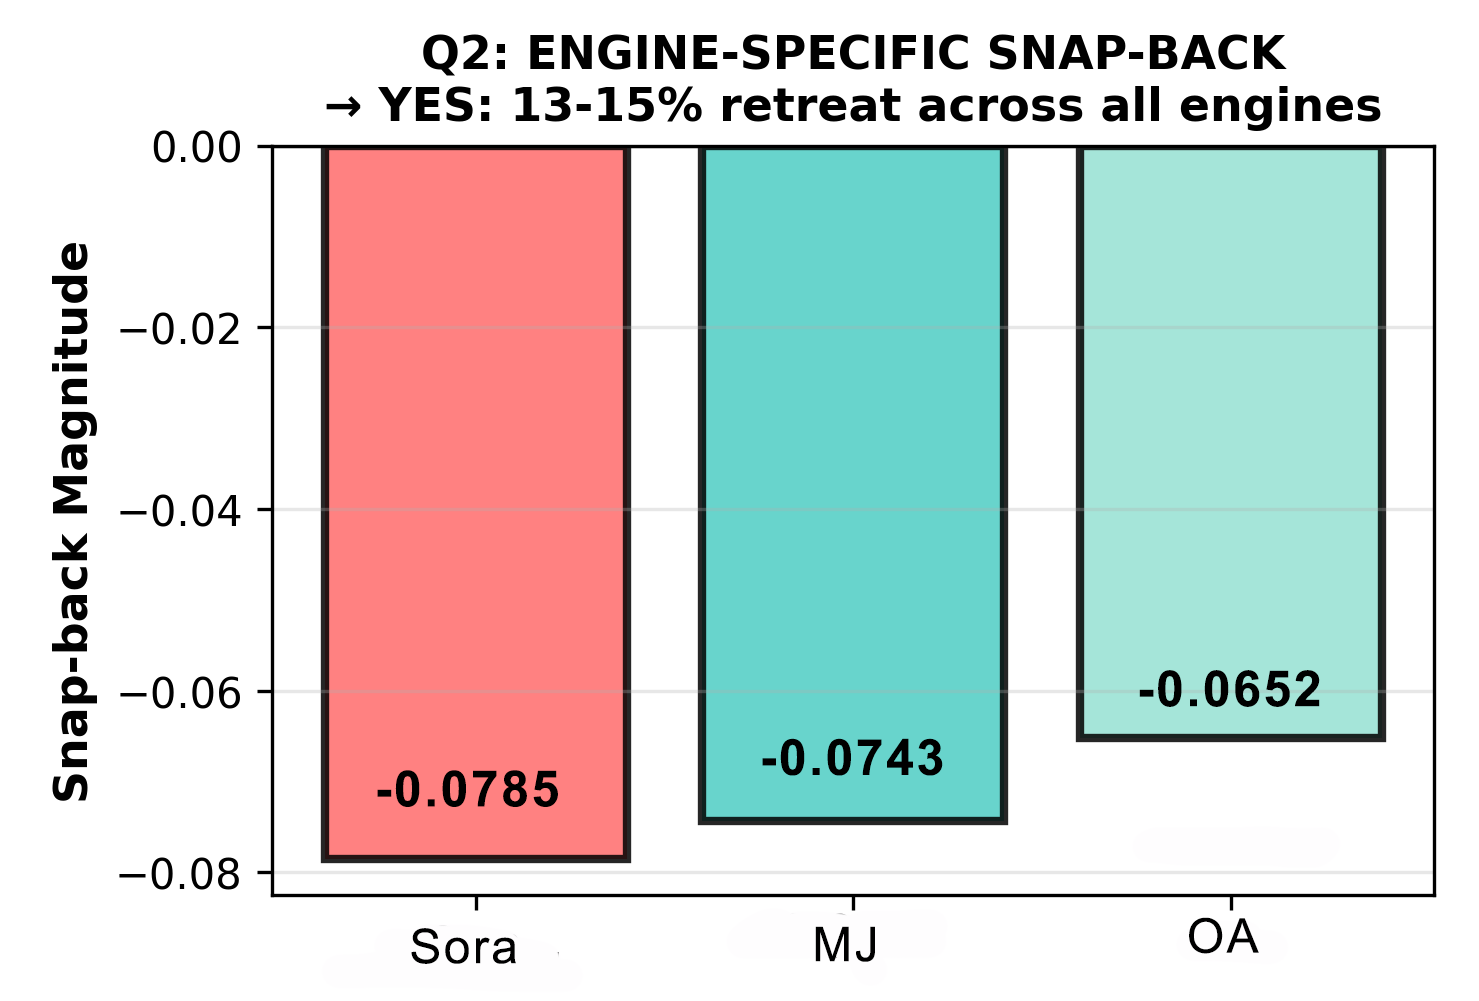
4.1 Finding 1: 13–15% Snap-Back Constraint
When prompted to arrange objects to one side of the frame (Side condition), all three engines retreated from their maximum Decentered displacement toward center. Retreat is measured as the percentage change in peripheral pull (xₚ) from Decentered peak to Side response.
| Engine | Peak xₚ (Decentered) | Side xₚ | Snap-back (Δxₚ) | % Retreat |
|---|---|---|---|---|
| Sora | 0.5858 | 0.5072 | −0.0785 | −13.41% |
| MidJourney | 0.5133 | 0.4390 | −0.0743 | −14.47% |
| OpenAI | 0.4714 | 0.4062 | −0.0652 | −13.83% |
| Mean | −0.0727 (±0.007) | −13.90% (±0.56%) |

The consistency of the pattern, three engines with different architectures, training sets, and aesthetic objectives all retreating within 1.06 percentage points of each other, indicates a shared structural phenomenon rather than engine-specific variance. The Decentered prompt successfully displaced mass outward, exceeding each engine's Neutral baseline. The Side prompt attempted to push further and triggered a consistent constraint response.
Interpretation: All three engines have a measurable compositional attractor basin, a structural default that resists spatial excursion beyond a threshold. The 13–15% figure quantifies that resistance: the basin boundary and its strength. An increase in this percentage in a post-update measurement would indicate that the attractor basin has grown stronger, meaning spatial controllability has degraded.

4.2 Finding 2: Prompt Movement Dominates Engine Separation (2.6×)
Prompt-induced coordinate movement (within-engine, across conditions) is 2.6× larger than engine-to-engine baseline separation (across engines, within the same condition):
- Within-engine prompt shift (Neutral → Decentered): 0.14 in (Δx, xₚ) space
- Between-engine separation (same prompt, across engines): 0.05 in (Δx, xₚ) space
- Ratio: 0.14 / 0.05 = 2.6×
This finding validates the kernel as a controllability detector rather than a static prior mapper. If the kernel were primarily registering training data biases or aesthetic defaults, engine-to-engine separation would dominate: each engine would occupy a distinctive compositional region regardless of prompt. Instead, prompt following, behavioral responsiveness to spatial instructions, is the stronger signal by more than a factor of two.
Monitoring application: This ratio functions as a controllability index. If it drops from 2.6× to 1.5× in a post-update measurement, prompt following fidelity has decreased by approximately 42%. Operational thresholds:
Warning: ratio < 2.0× (approximately 23% degradation in controllability)
Critical: ratio < 1.5× (approximately 42% degradation in controllability)
4.3 Finding 3: Signal-to-Noise Ratio Varies by Engine
Signal-to-noise ratio (SNR) quantifies the ratio of prompt-induced coordinate movement (signal) to within-prompt variance (noise), measured on xₚ:
SNR = (between-prompt range) / (average within-prompt standard deviation)
| Engine | Between-Prompt Range | Avg. Within-Prompt Std. | SNR | Classification |
|---|---|---|---|---|
| Sora | 0.181 | 0.043 | 4.2 | Clean |
| MidJourney | 0.129 | 0.096 | 1.3 | Noisy |
| OpenAI | 0.108 | 0.080 | 1.3 | Noisy |
SNR interpretation thresholds:
SNR > 3.0: Strong signal: clean measurement, small samples sufficient
SNR 1.5–3.0: Moderate signal: measurable but requires larger batches
SNR < 1.5: Weak signal: variance dominates, large samples required
Sora (SNR = 4.2): Prompt-induced shift (0.181) is more than four times within-prompt noise (0.043). Reliable drift detection with n ≈ 15–20 images per condition, achieving 80% statistical power to detect a 2σ behavioral shift.
MidJourney / OpenAI (SNR = 1.3): Prompt effects barely exceed within-prompt variance. Equivalent detection power requires n ≈ 40–50 images per condition, roughly 2.5× the sample size needed for Sora.
This difference is operationally significant. Sora's high SNR enables cost-effective monitoring on every model build with small test batches. MidJourney and OpenAI require substantially larger test sets for statistically reliable regression detection.
5. Applications
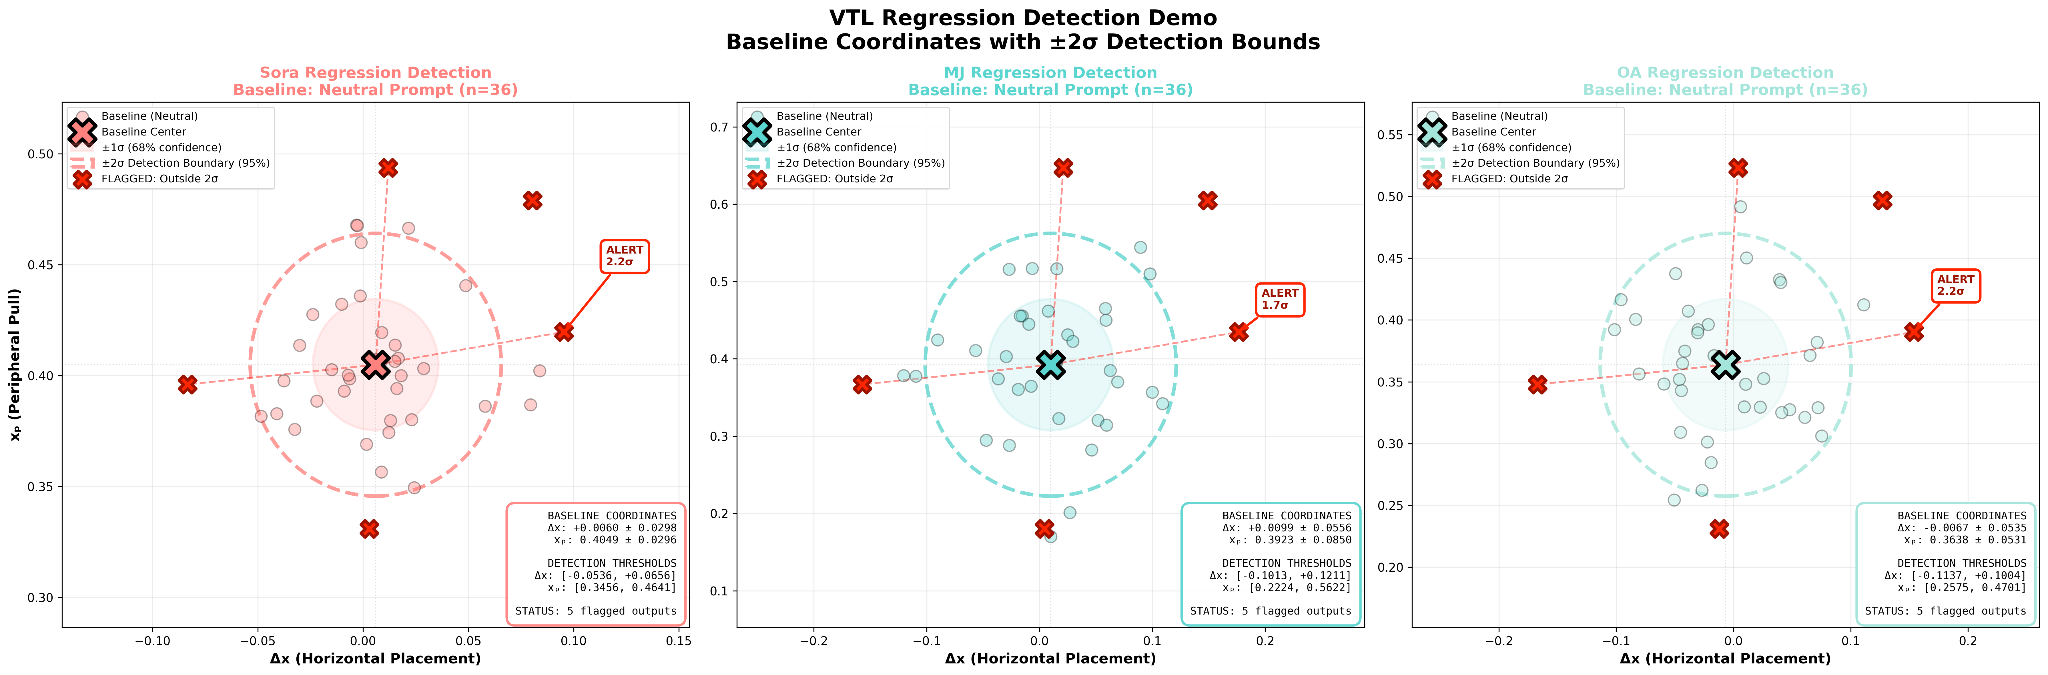
5.1 Model Update Regression Detection
Baseline kernel coordinates are established for any engine using a neutral-prompt calibration set. Subsequent post-update test sets are measured against this baseline; coordinates falling outside ±2σ from the baseline distribution trigger a behavioral regression flag. This approach is automated, objective, and sensitive to 2σ shifts, all without human review or semantic analysis.
| Engine | Δx mean (±std) | xₚ mean (±std) | Flag if |Δx| > | Flag if xₚ outside |
|---|---|---|---|---|
| Sora | +0.006 (±0.030) | 0.405 (±0.030) | 0.066 | [0.345, 0.465] |
| MidJourney | +0.010 (±0.056) | 0.392 (±0.085) | 0.122 | [0.222, 0.562] |
| OpenAI | −0.007 (±0.054) | 0.364 (±0.053) | 0.115 | [0.258, 0.470] |
Concrete example: A post-update Sora test generating images with xₚ = 0.55 falls 4.8σ above the Neutral baseline (0.405 ± 0.030). This constitutes a statistically detectable behavioral shift.

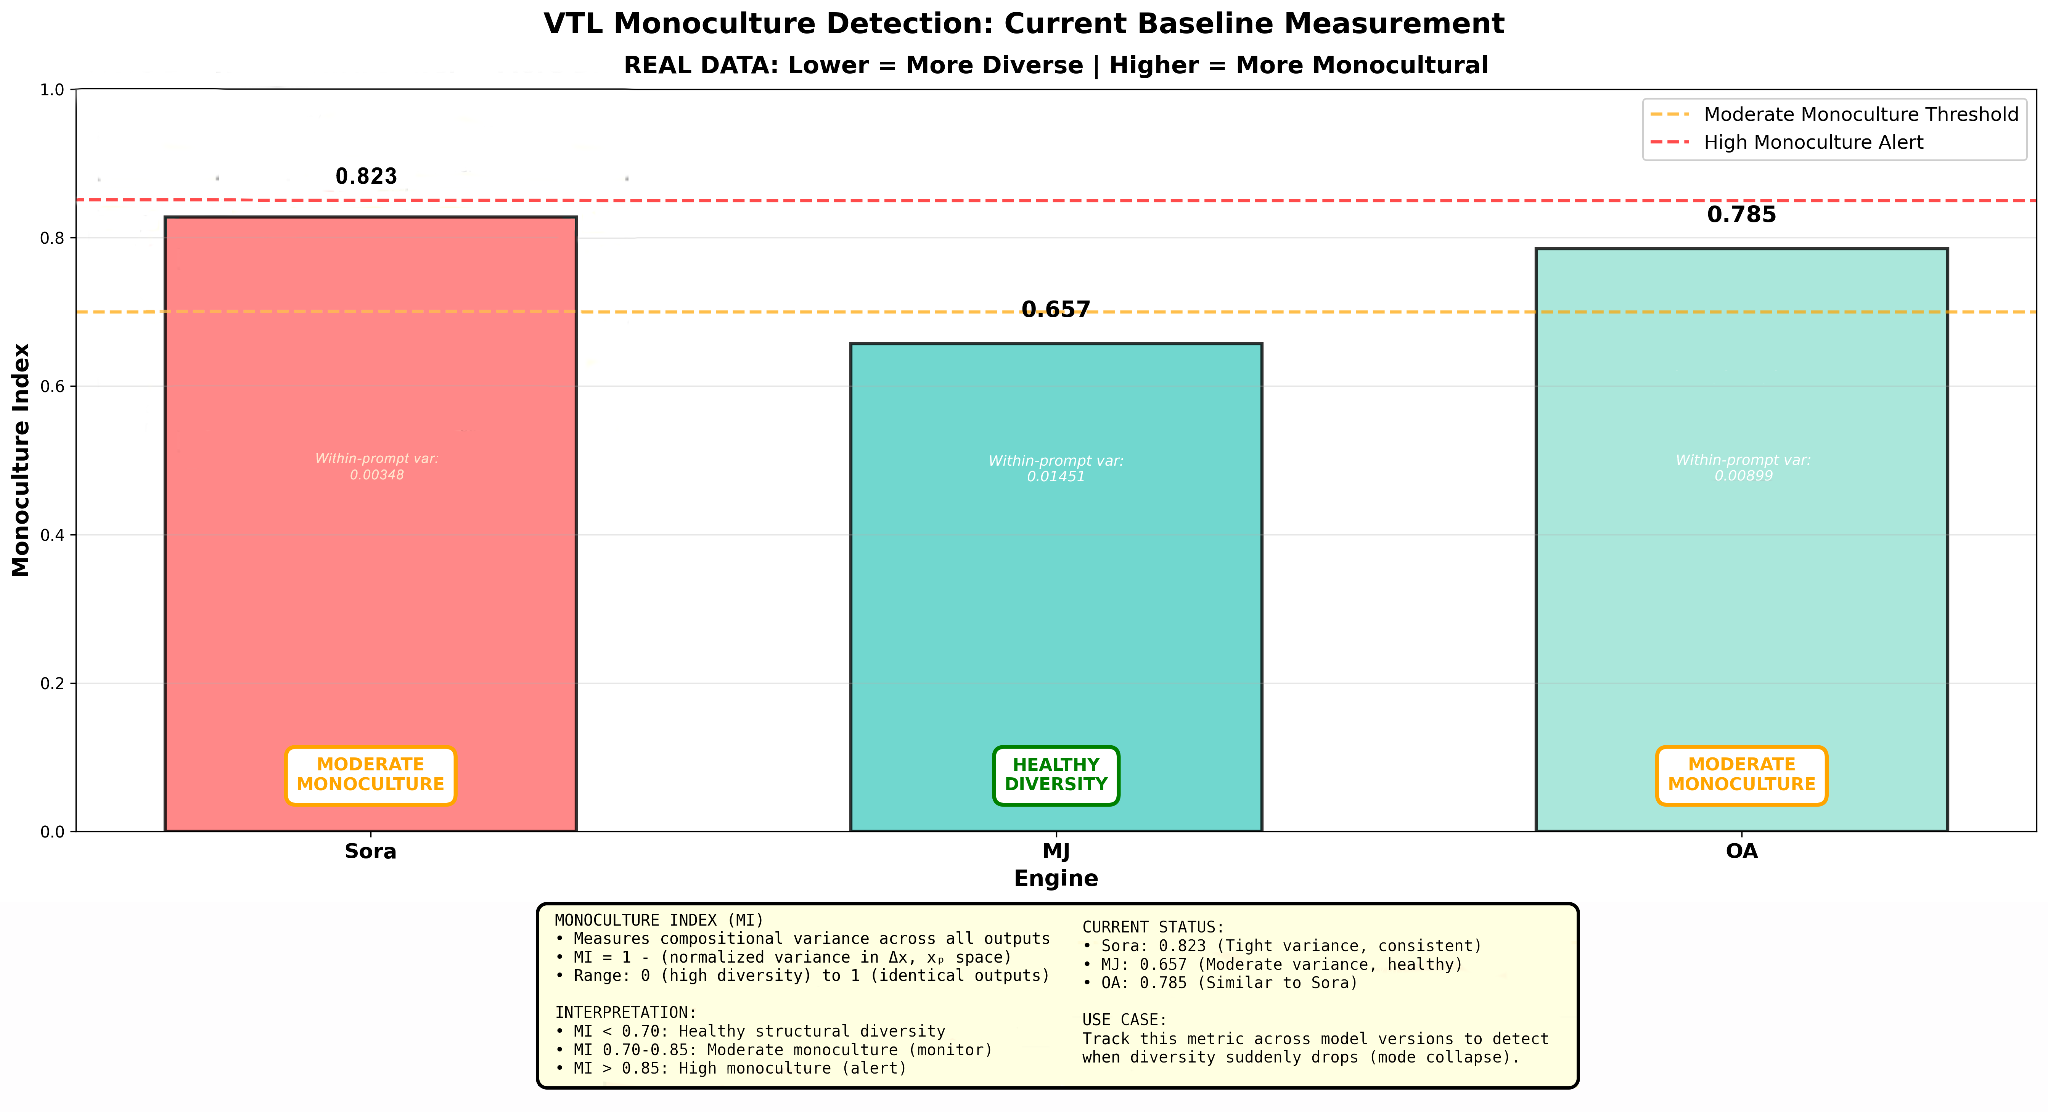
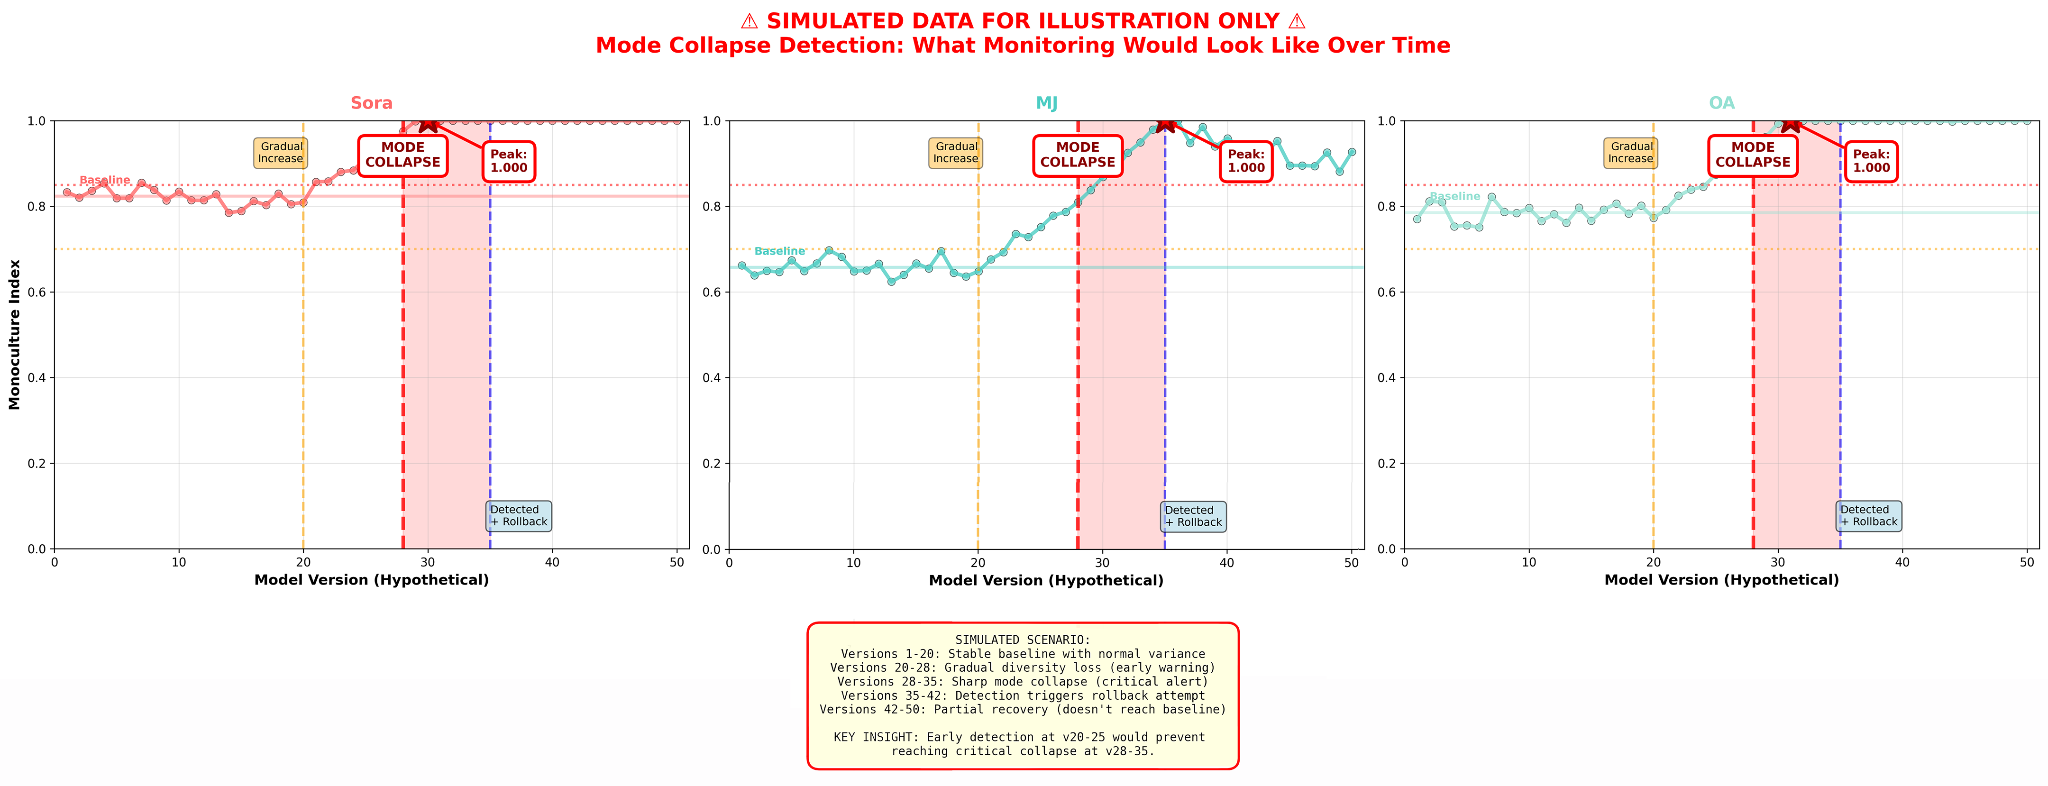
5.2 Monoculture and Mode Collapse Detection
Mode collapse in generative models is structurally detectable before it becomes semantically apparent. A model developing a compositional monoculture produces outputs with decreasing within-prompt variance in kernel coordinates, even as semantic content continues to vary: different objects, different scenes, different subjects, but the same spatial arrangement every time. Standard evaluation would pass such a model. The kernel flags it.
The Monoculture Index (MI) quantifies this structural diversity:
MI ranges [0, 1], where 0 is maximally diverse and 1 represents structurally identical outputs. A sudden increase in MI from baseline constitutes a mode collapse signal; a sudden decrease may indicate structural instability or training disruption.
| Engine | Δx std (Neutral) | xₚ std (Neutral) | Monoculture Index (MI) | Classification |
|---|---|---|---|---|
| Sora | 0.030 | 0.030 | 0.823 | Moderate monoculture |
| MidJourney | 0.056 | 0.085 | 0.657 | Healthy diversity |
| OpenAI | 0.054 | 0.053 | 0.785 | Moderate monoculture |

Monitoring thresholds (change from baseline MI):
±0.05: Stable: within normal variation
+0.10: Warning: structural diversity narrowing
+0.15: Critical: mode collapse suspected
5.3 Structural Anomaly Flagging
The kernel defines a normal operational envelope from benign prompt conditions. Outputs falling outside this envelope, regardless of semantic content, are flagged as structural anomalies. This enables detection of when prompts push models into unusual behavioral territory, without requiring semantic understanding of what those prompts contain.
Operational thresholds from this study (Sora, Neutral baseline):
Normal: anomaly score < 0.09 (95% of Neutral/Centered images)
Decentered: score = 0.181 → FLAG (outside normal envelope)
Side: score = 0.102 → FLAG (outside normal envelope, less severe)


Important limitation on anomaly detection: VTL flags structural anomalies but cannot distinguish between creative breakthroughs, safety violations, and model instability. The score measures distance from a compositional baseline. What that distance represents, innovation, error, or risk, requires human judgment and domain context.
Recommended tolerance thresholds by deployment context: creative workflows (flag only >4σ outliers) · production monitoring (review all >2σ deviations) · research (document all anomalies to characterize model range).
6. Relation to Existing Evaluation Methods
VTL is structural measurement infrastructure. It occupies a layer that existing evaluation approaches do not address and operates orthogonally to each of them:
| System | What It Detects | What VTL Adds |
|---|---|---|
| Content safety filters | Hate speech, violence, CSAM, policy violations (semantic) | Behavioral drift in the structural outputs those systems produce; detects when safe-appearing outputs begin composing differently |
| CLIP-based metrics | Semantic similarity, whether a subject is present | Where that subject is placed and how mass is organized around it; a centered and a decentered image of the same subject score identically on CLIP, differently on VTL |
| FID (Fréchet Inception Distance) | Distribution distance between generated and training outputs | Explicit baseline comparison against a defined reference with quantified tolerance; FID cannot separate compositional bias from other distributional properties |
| Aesthetic predictors | Human preference scores (learned from the same biased training population) | Compositional consistency and structural diversity; monoculture and diverse outputs can score identically on aesthetic metrics while differing substantially on MI |
| Interpretability tools | Internal model behavior: attention, activations, circuits (requires model access) | External behavioral measurement from rendered output; applicable to closed commercial systems where model internals are unavailable |
VTL does not replace any of these systems. It provides the structural observation layer that all of them omit.
7. Limitations
Behavioral, not content detection
VTL measures geometric structure, not semantic content. A structurally normal image can contain harmful content; a structurally anomalous image may be a legitimate creative breakthrough. VTL must be used alongside content safety systems, not substituted for them. Structural anomaly and content violation are orthogonal signals.
Observation, not causation
VTL reveals that coordinates shifted; it cannot diagnose why. Changes in training data distribution, RLHF fine-tuning parameters, architectural modifications, or safety filtering are all structurally invisible, only their effects on output geometry are observable. Diagnosis of root cause requires additional investigation following any VTL flag.
Baseline dependency
Anomaly detection is calibrated against a defined baseline. What constitutes "normal" compositional behavior is context-dependent: a production deployment and a research sandbox may require different tolerance thresholds for the same engine. Baselines published with this paper reflect Neutral-prompt behavior across three specific engine versions; they will require recalibration as models are updated.
rᵥ lighting sensitivity
Unlike the other six metrics, which use percentile masking and are lighting-invariant, rᵥ uses an absolute gradient threshold (τabs = 0.15), making its values sensitive to illumination conditions. For cross-engine structural comparison, rᵥ requires gradient field context. For within-engine, version-to-version regression tracking, it is valid as an absolute density signal.
Scope: spatial composition only
The current kernel captures placement, density, boundary interaction, material thickness, and directional coherence. Color distribution, temporal coherence for video outputs, and high-frequency texture patterns are outside the current specification and require separate measurement frameworks.
8. Conclusion
Foundation models exhibit measurable compositional priors that are invisible to semantic evaluation but detectable through geometric analysis. The three findings reported here establish behavioral coordinates for three leading engines and demonstrate their utility as regression baselines: a consistent 13–15% snap-back from compositional basin boundaries quantifies a hard limit on spatial controllability; a 2.6× dominance of prompt-induced over engine-baseline coordinate shifts confirms the kernel as a behavioral response metric; and substantial engine-to-engine SNR variance, Sora: 4.2; MidJourney and OpenAI: 1.3, determines minimum sample sizes for statistically reliable drift detection.
The VTL kernel provides the structural measurement layer that current evaluation infrastructure omits. It is deterministic, model-agnostic, and operable entirely from rendered output, requirements that semantic, aesthetic, and mechanistic evaluation approaches cannot simultaneously satisfy. No model access is required. No training data is required. The same image produces the same coordinates in every compliant implementation.
The operational frameworks derived from this study, automated regression detection against published baselines, Monoculture Index monitoring for structural diversity loss, and Euclidean anomaly scoring for structural outlier detection, are deployable without modification as evaluation infrastructure for production generative systems. Baseline coordinates for the three engines tested here are published with this paper to enable immediate cross-version comparison. Contact for standardized test protocol and calibration materials.