VTL v3.1 + PTD-Z · Semiconductor Inspection

Semiconductor patterns
have topology.
Measure it.

A physics-grounded, modality-agnostic structural coordinate framework for semiconductor inspection imagery. Fifteen coordinates derived from image formation first principles — no learned parameters, no domain-specific retraining.

The coordinate system does not fit domain-specific statistics. It tracks changes in visual organization consistent with how each modality physically forms images.

Benchmark 1 Carinthia SEM · 4,579 images · 93.4% ± 3.4% balanced accuracy
Benchmark 2 MixedWM38 wafer maps · 7,015 maps · 94.9% ± 0.2%
Benchmark 3 NIST SEM degradation · 3,402 images · PTD-Z breach ratio 0.9477
Modalities Production SEM · binary wafer maps · aerial lithography simulation
93.4%
SEM balanced accuracy
Carinthia semiconductor SEM, 5-fold CV, 4,579 images. First among all classical baselines. Zero learned parameters.
94.9%
Wafer map accuracy
MixedWM38, 7,015 maps. 7.59× lift over Hu moments, which collapse to chance (12.5%) on wafer maps.
0.9477
PTD-Z breach ratio
NIST SEM degradation corpus, 3,402 images. Pattern topology drift tracking confirmed across the degradation range.
15
Physics coordinates
All derived from image formation first principles. Same 15 coordinates, no adaptation, across SEM, wafer maps, and aerial imagery.

Physics-grounded coordinates
that transfer without retraining.

Visual Topology of Light — VTL v3.1

The coordinate framework

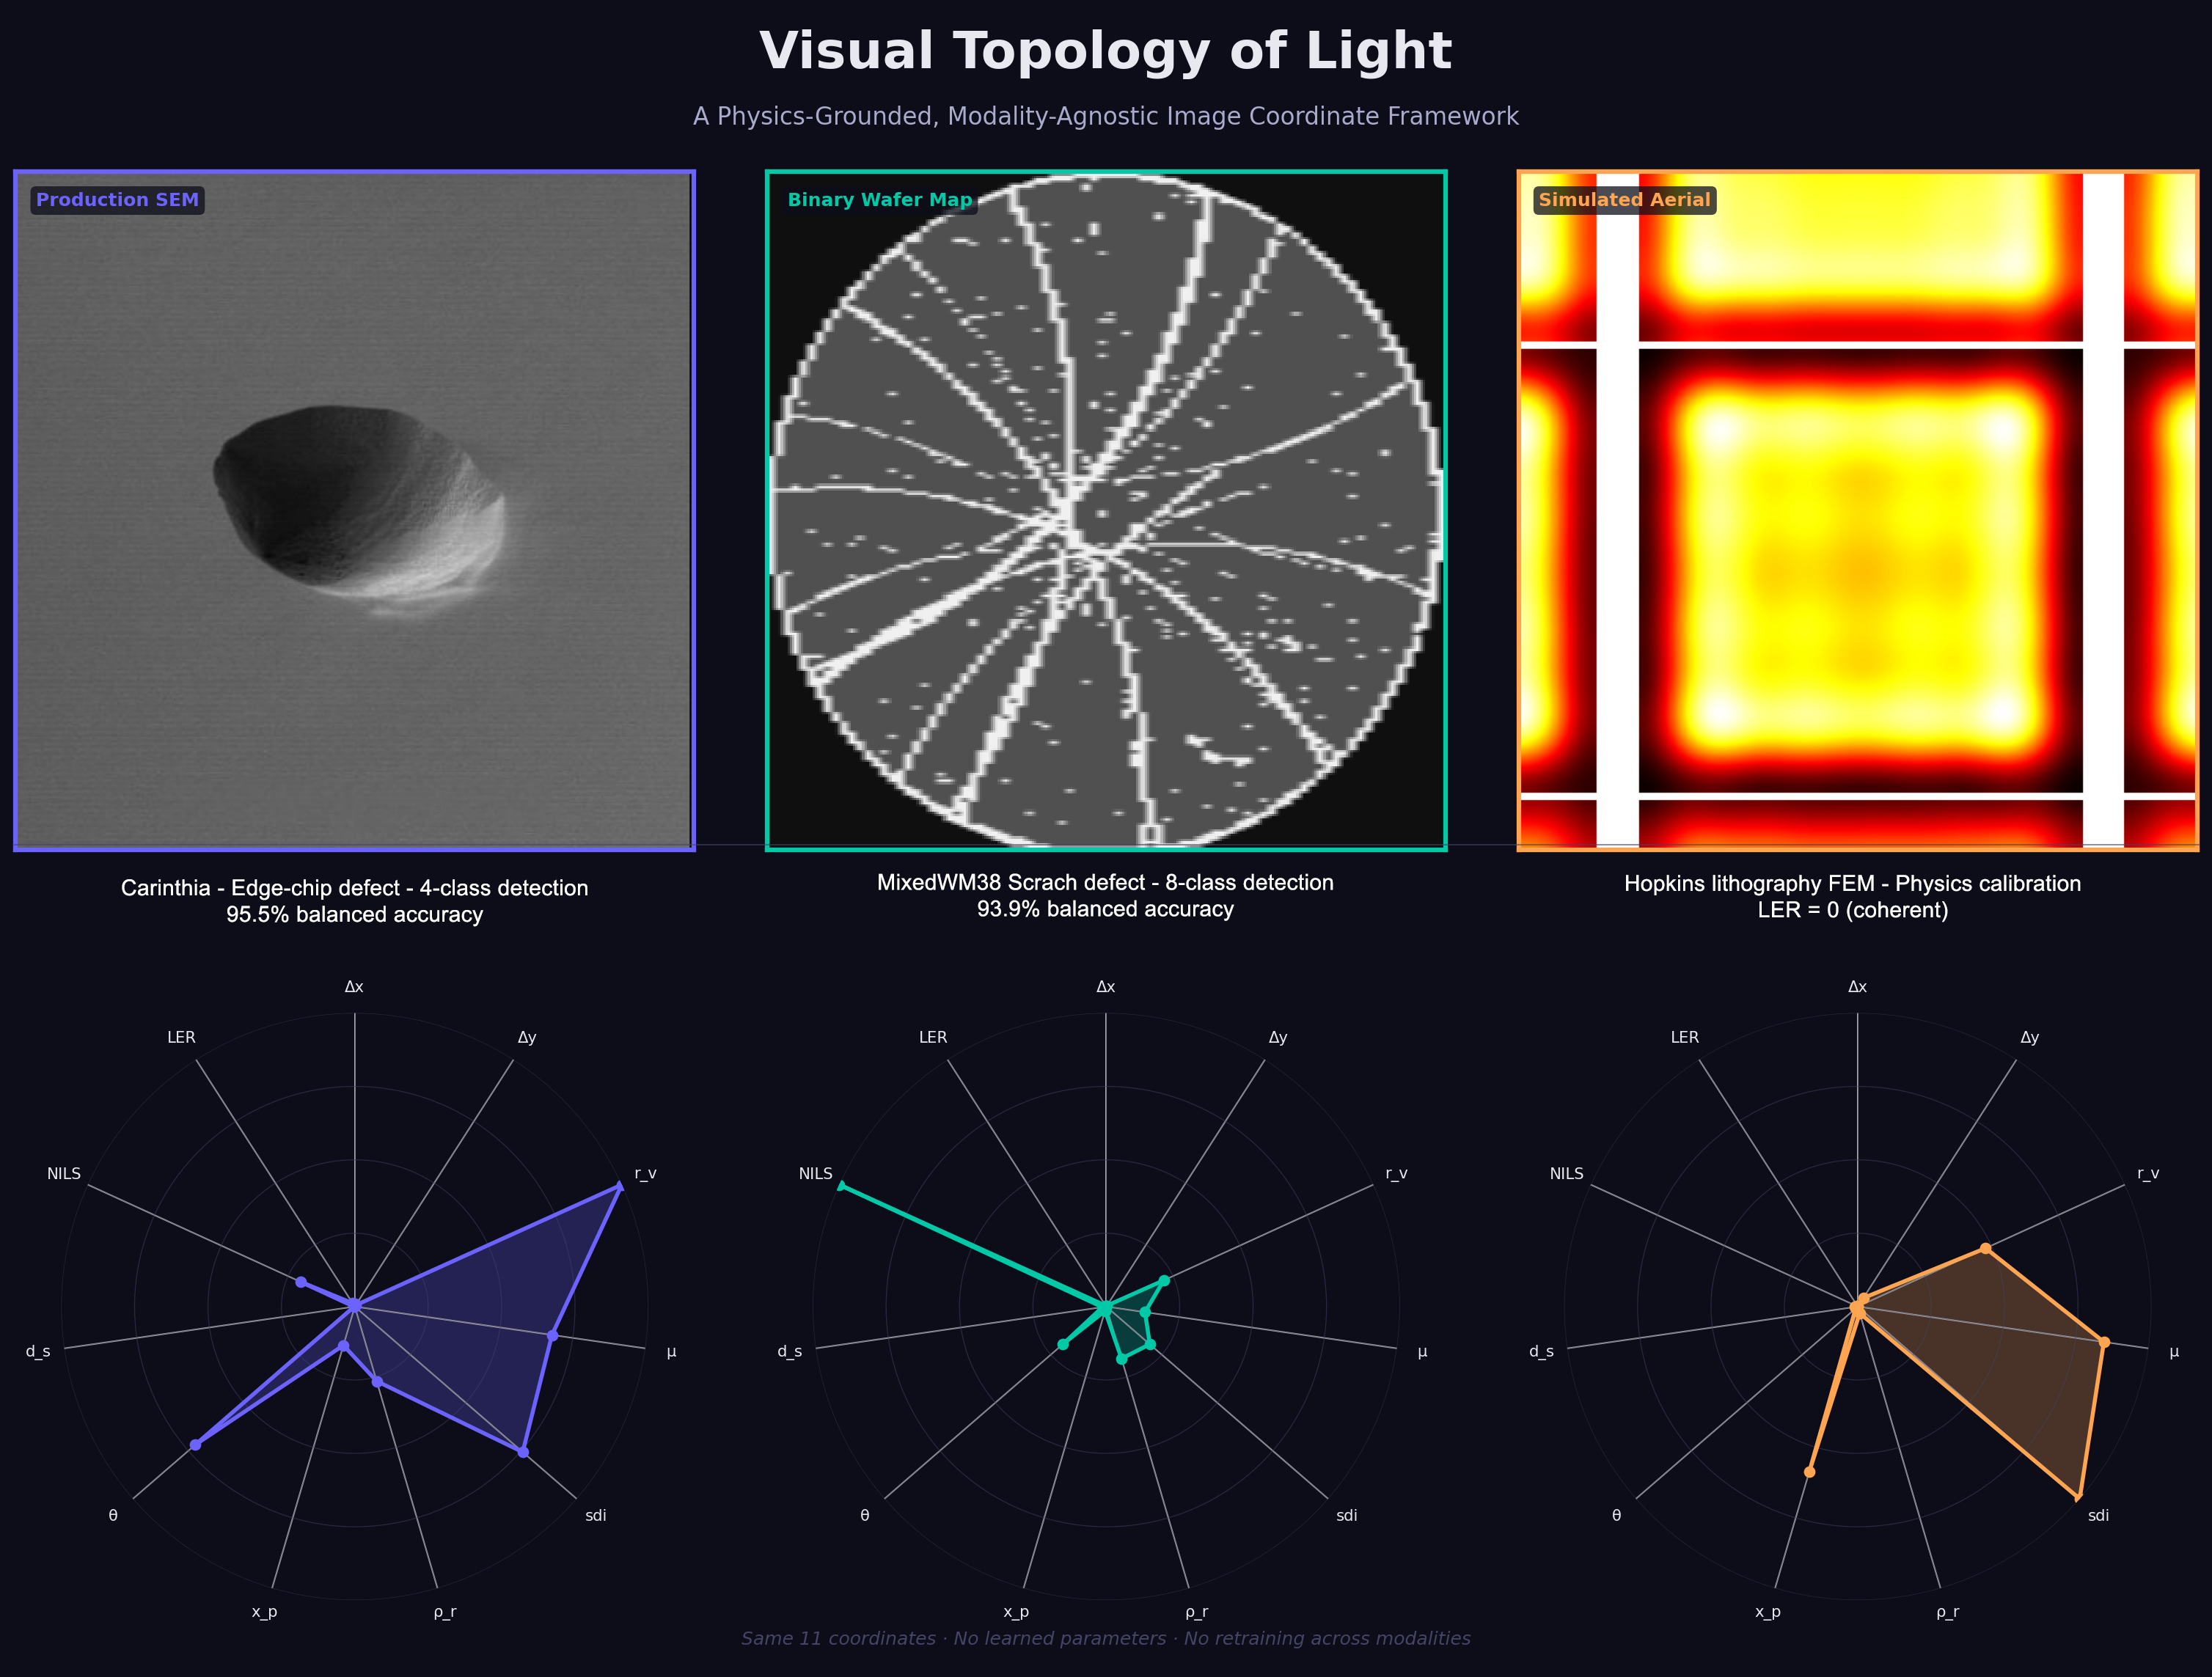
VTL is a 15-coordinate image descriptor derived from image formation first principles rather than fitted to data. Coordinates include established lithography metrology quantities — NILS (Normalized Image Log Slope, the standard edge sharpness measure) and LER (Line Edge Roughness, the standard stochastic noise metric for printed edges) — extended into image-domain structural topology. The framework is predictive rather than descriptive: the math precedes the application. It cannot transfer to a new imaging modality without domain-specific modification if it is domain-fitted; it can transfer if it is physics-derived. LER is identically zero on coherent simulated aerial images, confirmed before any real data was examined. That is not a classification result. It is a physics prediction.

PTD-Z Pattern Topology Drift Monitor

The route grammar built on top

PTD-Z extends VTL into a routed structural telemetry framework. The practical inspection problem is not only whether an image is unusual — it is whether the pattern has stopped behaving like the structure it was expected to be, and whether the unusual evidence can be translated into a reviewable structural statement. PTD-Z decomposes measurement into six route families, each carrying a process-facing hypothesis and a refusal condition for claims the evidence cannot yet support. It treats refusal as a first-class method component, not an afterthought: PTD-Z does not replace classical descriptors or inspection tools. It reorganizes image evidence into interpretable routes, tests how much survives classical baselines, and refuses process-causal claims without process-linked data.

Instrument Pipeline
Visual Topology of Light — Processing Pipeline Input Image SEM / wafer map aerial / any modality Grayscale + Norm min-max normalize to [0, 1] VTL v3.1 Extract 15 coordinates no learned params StandardScaler fit on reference transform query SVM Classifier RBF kernel class_weight=balanced Result class + probability + structural position delta_x · delta_y · r_v · mu · sdi · rho_r · x_p · theta · d_s · nils · ler · edge_density · ds_low · ds_mid · ds_high

The coordinate set.
All from first principles.

Coordinate Label Physical Meaning Version
delta_x / y
Centroid offset
Intensity-weighted centroid displacement from image center. Detects asymmetric defect placement and overlay shifts. Largest residual PTD-Z route after classical descriptors in independence audits.
v1
r_v
Radial variance
Radial variance of intensity mass about centroid. High = diffuse/ring defects. Low = center-concentrated. Encodes ring vs. center defect topology on wafer maps.
v1
mu
Mean intensity
Mean normalized intensity. Encodes defect density and global brightness. Dominant coordinate on density-encoded binary wafer maps where defect fill fraction is the primary signal.
v1
sdi
Spatial dispersion
Normalized Shannon entropy of the 64-bin intensity histogram. High = complex texture. Low = uniform regions. Leads with NILS on focus sensitivity ranking.
v1
rho_r
Radial correlation
Pearson correlation between radial distance from centroid and intensity. Encodes whether bright regions are central (negative) or peripheral (positive).
v1
x_p
Peak X offset
Horizontal offset of intensity peak from centroid. Tracks sub-pixel displacement with R²=0.988 across full range; 65% image-width sensitivity per pixel.
v1
theta
Gradient orientation
Intensity-weighted dominant gradient orientation. Detects scratches, line patterns, and oriented line-space features. Part of pitch/phase route in PTD-Z.
v1
d_s
Spectral spread
Center of mass of FFT power spectrum. High = fine spatial detail. Low = coarse structure. Dominant on binary wafer maps where defect topology is encoded in spatial frequency.
v1
nils
Edge sharpness (NILS)
Normalized Image Log Slope — standard lithography metrology quantity. Strongest reference-free focus indicator (R²=0.975 against |focus|), near-linear across the full DOF range. Leads on SEM imagery.
v2
ler
Edge roughness (LER)
Std of lateral contour deviation, normalized by image diagonal. Standard stochastic noise metric for printed edges. Identically zero on coherent simulated aerial images — a physics prediction confirmed before real data was examined.
v3
edge_density
Canny edge fraction
Fraction of Canny edge pixels. High = dense/complex structure. Low = smooth/uniform. Contrast-immune (R²/contrast < 0.10).
v3.1
ds_low
Low-frequency power
FFT power fraction in low-frequency band (f < f_max/3). High = coarse/large-scale structure. Part of spectral band decomposition enabling frequency-separated analysis.
v3.1
ds_mid
Mid-frequency power
FFT power fraction in mid-frequency band. Captures intermediate spatial scale — pitch-related periodicity in line-space patterns.
v3.1
ds_high
High-frequency power
FFT power fraction in high-frequency band (f ≥ 2f_max/3). High = fine detail, edge-dominated. Tracks grain noise and edge roughness at sub-pattern scale.
v3.1

Six routes. Each with a hypothesis
and a refusal condition.

Route Family
Process-Facing Hypothesis
Refusal Condition
image_geometry
Overlay, placement, or pattern displacement. Largest residual route after Classical_All in both Carinthia and NFFA audits.
Registration or product mix explains the shift — geometry route refires on both.
pitch / phase
Pitch drift, dose/focus interaction, or periodic-order loss in line-space structures.
Frequency evidence is broad and lacks a primary route — most defensible independence route in audits.
material_topology
Bridges, breaks, missing/extra material, etch bias — structural completeness failures.
Texture or contrast explains the same signal — topology route becomes support evidence.
contrast / gradient
Focus, charging, illumination, or resist variation — field-level intensity organization.
Repeat scans show imaging-only instability — contrast route treated as support rather than primary.
signal / noise
SEM noise, beam settings, focus-like degradation in the sub-pattern band.
Noise route fires without stable structure below it — demoted to overlap or caveat signal.
residual / support
Design/reference mismatch when paired reference data exists.
No paired reference or primary route supports it — refusal blocks promotion to causal claim.

Validation Overview

Visual Topology of Light — SEM defect, wafer map, and aerial lithography with VTL radar fingerprints

Three modalities.
Three different image physics.

Carinthia SEM · Semiconductor Defect Classification
Physics-derived coordinates match best classical baseline on production SEM imagery.

4,579 production SEM images from one semiconductor layer, six defect classes. VTL achieves 93.4% ± 3.4% balanced accuracy (5-fold CV), first among Haralick GLCM, HOG, LBP, Hu moments, and Zernike moments. PTD-Z adds +0.0214 macro F1 over Classical_All in independence audit. image_geometry is the most defensible residual route — pitch_phase shows the strongest independence profile.

VTL balanced accuracy 93.4% ± 3.4%
Hybrid gain over Classical_All +0.0214 macro F1
Best single route (independence) image_geometry
Trained parameters 0
MixedWM38 / WM-811K · Wafer Map Grammar
The same coordinates that describe SEM defects describe wafer-level spatial grammar.

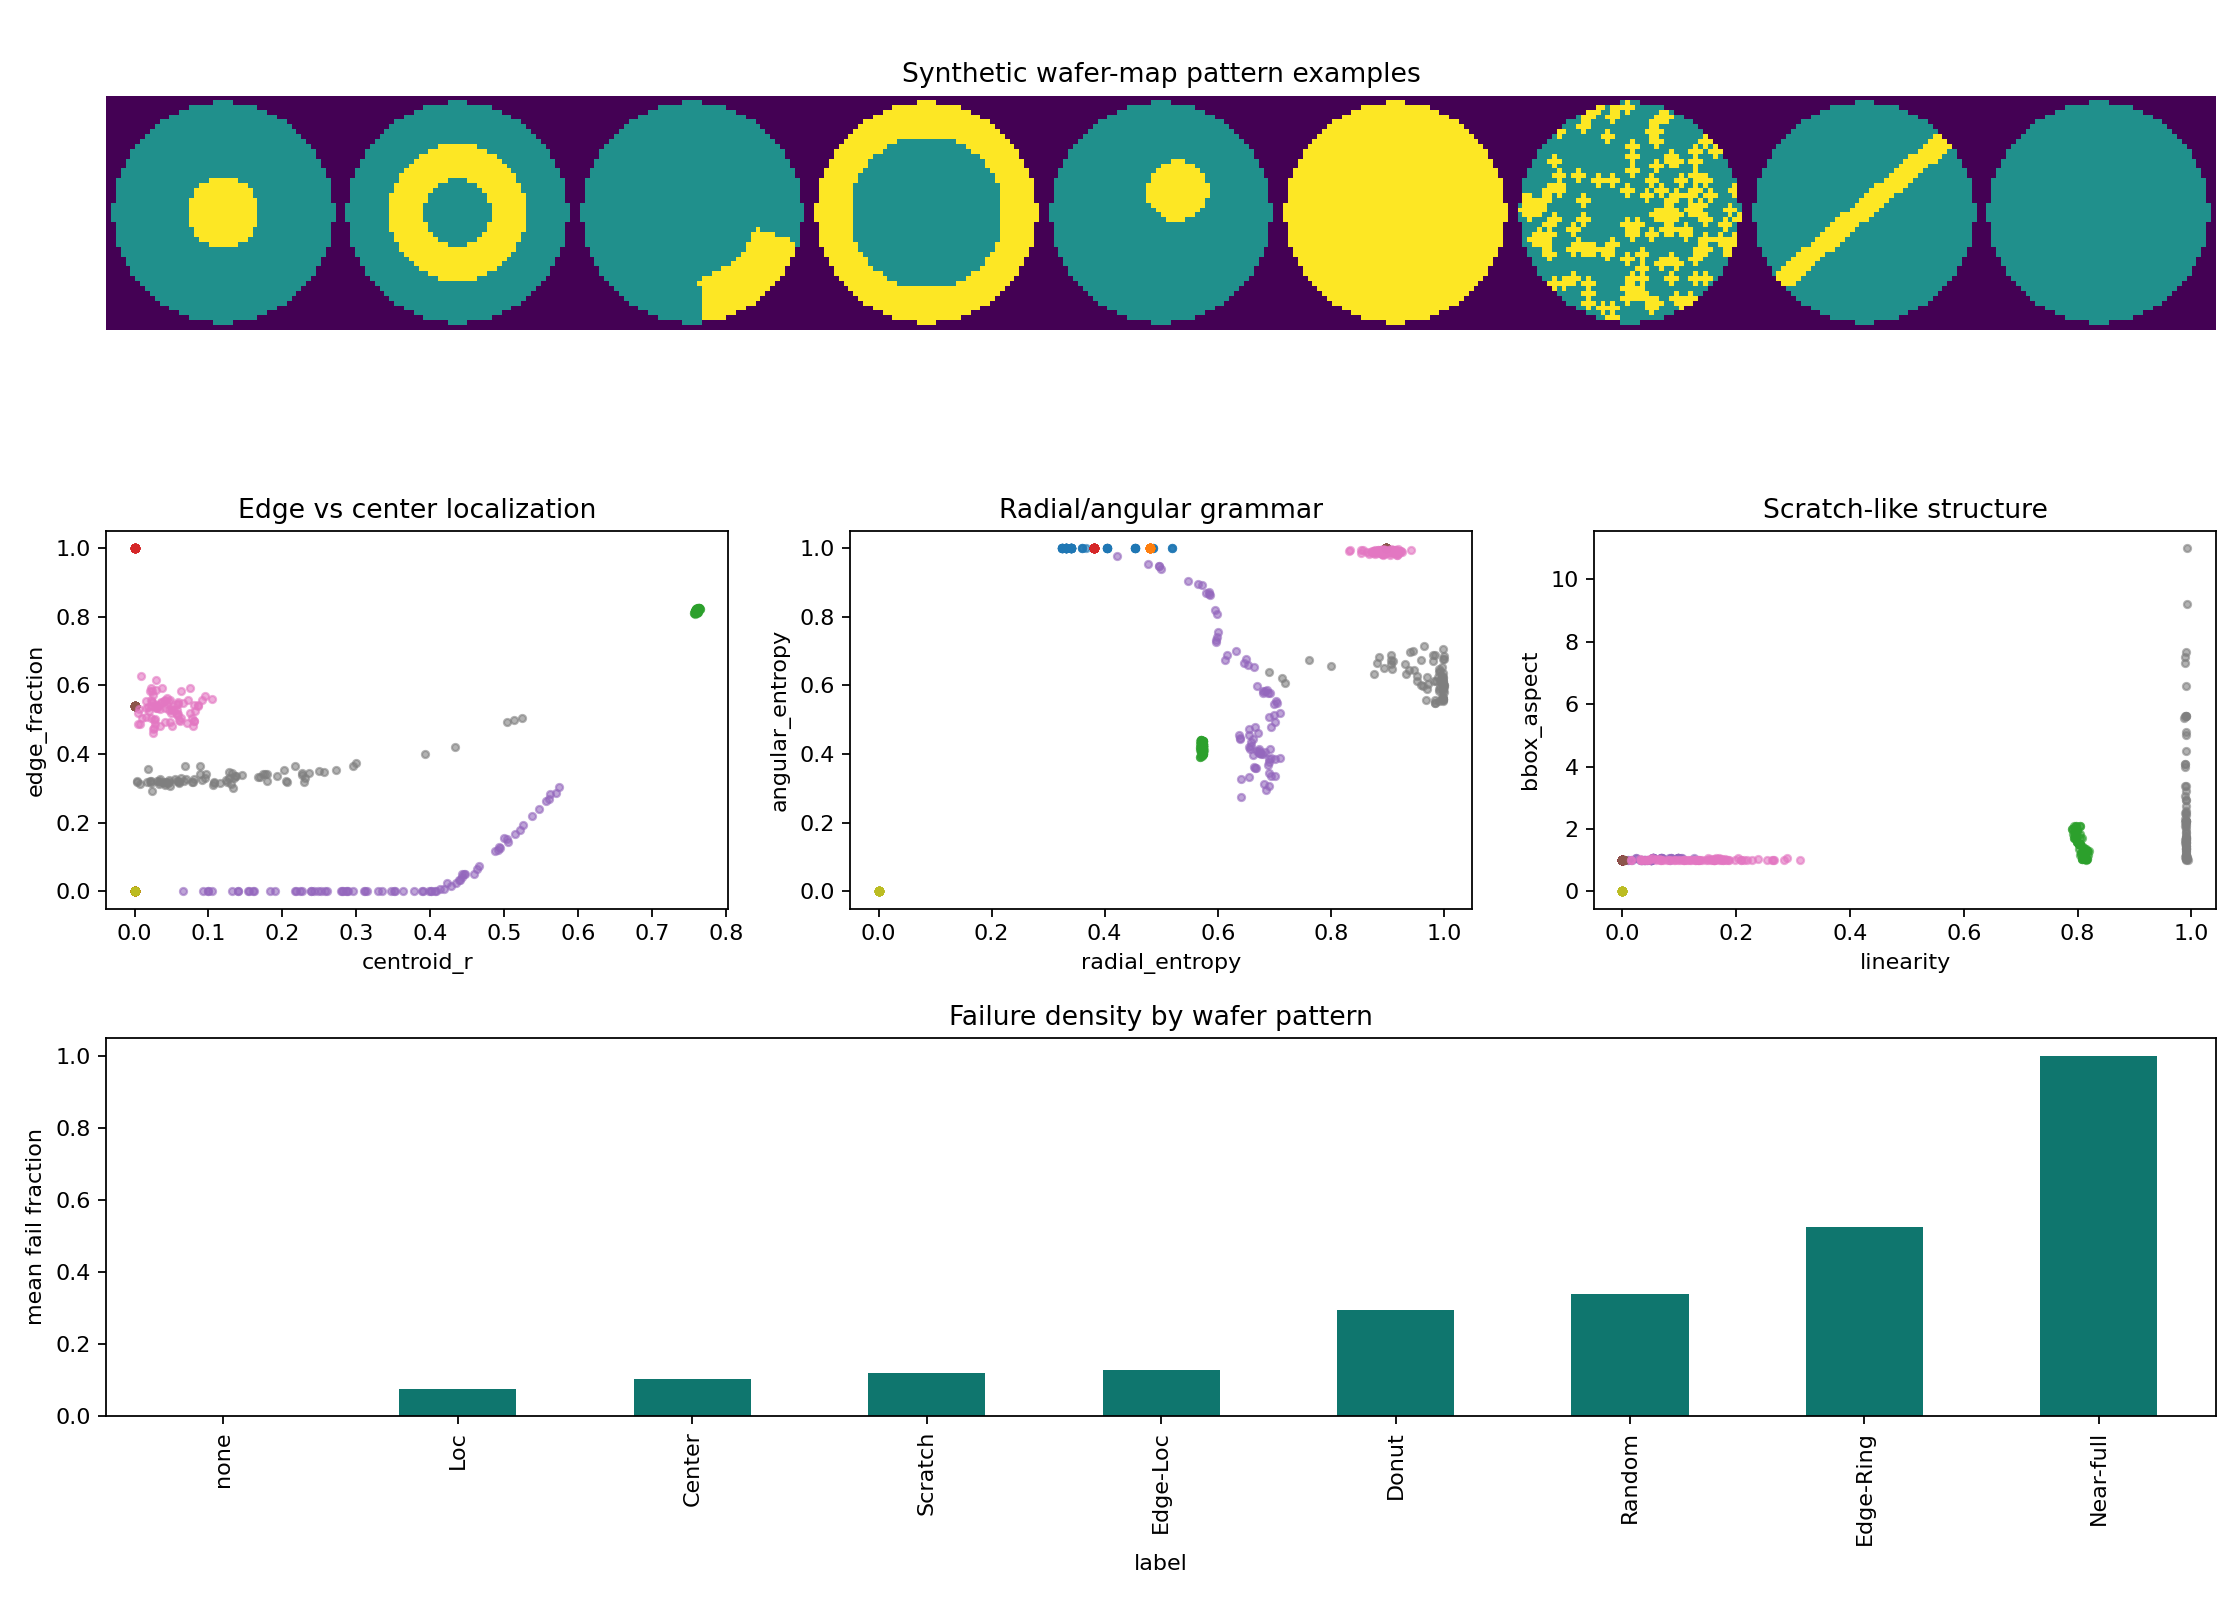
7,015 MixedWM38 wafer maps (8-class): 94.9% ± 0.2% balanced accuracy (7.59× lift over Hu moments, which collapse to chance at 12.5%). WM-811K (8,763 maps, 9-class): 67.5% ± 1.0% — ceiling consistent with a 45×48px resolution constraint, not class imbalance. Null-label shuffle collapses toward chance, confirming the coordinates carry real class signal. A constrained logistic layer over deterministic coordinates reaches 0.8859 macro F1 vs. 0.5609 for hand grammar alone.

MixedWM38 accuracy 94.9% ± 0.2%
Lift over Hu moments 7.59×
WM-811K constrained layer 0.8859 macro F1
Null-label shuffle result → chance (confirmed)
NIST SEM Degradation + Aerial Lithography
Drift tracking and physics-confirmed negative predictions across two additional modalities.

NIST SEM degradation (3,402 images): PTD-Z envelope breach ratio 0.9477 — Spearman ρ = −0.9485 between envelope norm and SSIM, −0.9184 with U-Net eval Dice. image_geometry and orientation_topology carry stronger Dice relationships than residual_only, arguing topology drift is not reducible to residual differencing alone. Aerial lithography simulation (mds2-3838, 3,402 images): LER identically zero on coherent defocus — a physics prediction confirmed before real data was examined. All 15 VTL v3.1 coordinates are contrast-immune (R²/contrast < 0.10).

NIST breach ratio 0.9477
SSIM Spearman ρ −0.9485
LER on coherent aerial = 0 (physics confirmed)
Contrast immunity R²/contrast < 0.10
WM-811K wafer map defect pattern overview — VTL structural coordinate analysis
WM-811K wafer map overview. Nine defect pattern classes across 4,149 balanced maps. The same 15 VTL coordinates that describe SEM edge geometry describe wafer-level spatial grammar. mu and d_s dominate wafer maps; LER and NILS lead on SEM — a systematic shift consistent with imaging physics.
The claim boundary, stated directly.

No public dataset in this work provides direct fab process-cause labels such as focus, dose, etch, chamber, maintenance, or overlay. Carinthia is real semiconductor SEM defect imagery, but it is a defect-class dataset, not a known-cause process sequence. PTD-Z intentionally refuses process-causal language when evidence is absent. The strongest current claim is residual organizational signal: PTD-Z adds information after Classical_All in both the semiconductor-specific Carinthia audit and the broader NFFA-Europe SEM morphology audit. PTD-Z should not replace classical descriptors. Hybrid systems outperform either alone. The claim is route grammar and residual interpretable signal — not descriptor replacement or fab root-cause proof. The next decisive artifact is a physical-sequence validation packet: 30–100 through-focus SEM images from a shared nanofab, metrology lab, or process partner, with known focus/Z offsets.

+0.021 hybrid macro F1 gain
over Classical_All
(Carinthia)
0/0 selected route overfire
on null labels /
broad primary routes
not proven fab root cause —
process-linked sequence
data required

A different question
requires a different instrument.

A trained classifier answers
Which defect class is this?

A fine-tuned CNN or foundation-vision model may outperform VTL on raw Carinthia defect classification — this paper does not test that question and makes no claim of classification superiority over deep learning. Trained classifiers achieve strong accuracy but require per-domain training data, cannot explain which physical properties drove the prediction, and do not transfer to new imaging modalities without retraining. They produce a verdict, not a physical reading.

VTL + PTD-Z answers
How has the structural topology of this pattern changed, and which physical route explains the change?

Continuous structural coordinates derived from image formation physics. The same 15 coordinates transfer across SEM, wafer maps, and aerial imagery without retraining because they track physical image organization, not domain statistics. PTD-Z adds route decomposition: selected route, runner-up, margin, process hypothesis, and refusal condition. If a classical descriptor explains the signal better, the system absorbs that fact rather than hiding it.

The 15-coordinate VTL vector is a structured, physically interpretable feature representation. It can be concatenated with any foundation model's learned embedding. The strongest results across all audits are hybrid systems — PTD-Z plus classical descriptors outperform either alone. The intended relationship is hybrid and complementary, not competitive. The 93.4% SEM accuracy figure is evidence that the coordinate space has real structural signal. Its value as a hybrid component, as a drift monitor, and as a physics-interpretable audit layer is not bounded by that ceiling.

The frontier
is explicit.

01
Physical-Sequence Validation

The decisive missing artifact is a through-focus SEM stack from a shared nanofab or metrology lab: 30–100 images of the same site or repeated pattern with known focus/Z offsets. This closes the gap between defect-class signal and process-cause routing.

02
Dose/Focus Matrix

A split-condition dose/focus matrix would test material, pitch, CD, and bridge routes simultaneously. PTD-Z is designed to route these into separate hypothesis families — the controlled experiment tests whether the decomposition is meaningful under known variation.

03
Deep-Learning Hybrid

The 58-axis structural vector concatenated with UNI, CONCH, or a ResNet embedding. VTL appears to carry mesoscale organizational signal that texture and moment descriptors do not fully preserve. Whether that gap survives deep learning embeddings is untested.

04
Route Stability at Scale

image_geometry and pitch_phase repeatedly survive independence audits; signal_noise and residual_only drift toward support roles. Whether this pattern is causal stability or a recurring artifact of the current audit design requires larger, process-linked studies.

05
448px Field of View

Current benchmark is fixed at 224–480px. The hypothesis that fiber-scale organization reads more cleanly at larger field width requires tiling from source WSIs or higher-resolution SEM acquisition. The experiment was designed; data access remains the constraint.

06
Overlay/Reference Pairs

The residual/support route requires paired image/reference data to move from support evidence to a primary route. 30–100 image/reference pairs with known overlay offsets would test geometry and phase displacement routing against a known ground truth.