Status: research prototype; public structural evidence; no fab-causal proof yet.
Primary claim: PTD-Z is best viewed as a Pattern Topology Drift Monitor: routed structural telemetry for asking whether an organized pattern has stopped behaving like the structure it was expected to be.
PTD-Z
Pattern Topology Drift Monitor — Routed Structural Telemetry
for Semiconductor Inspection
2026
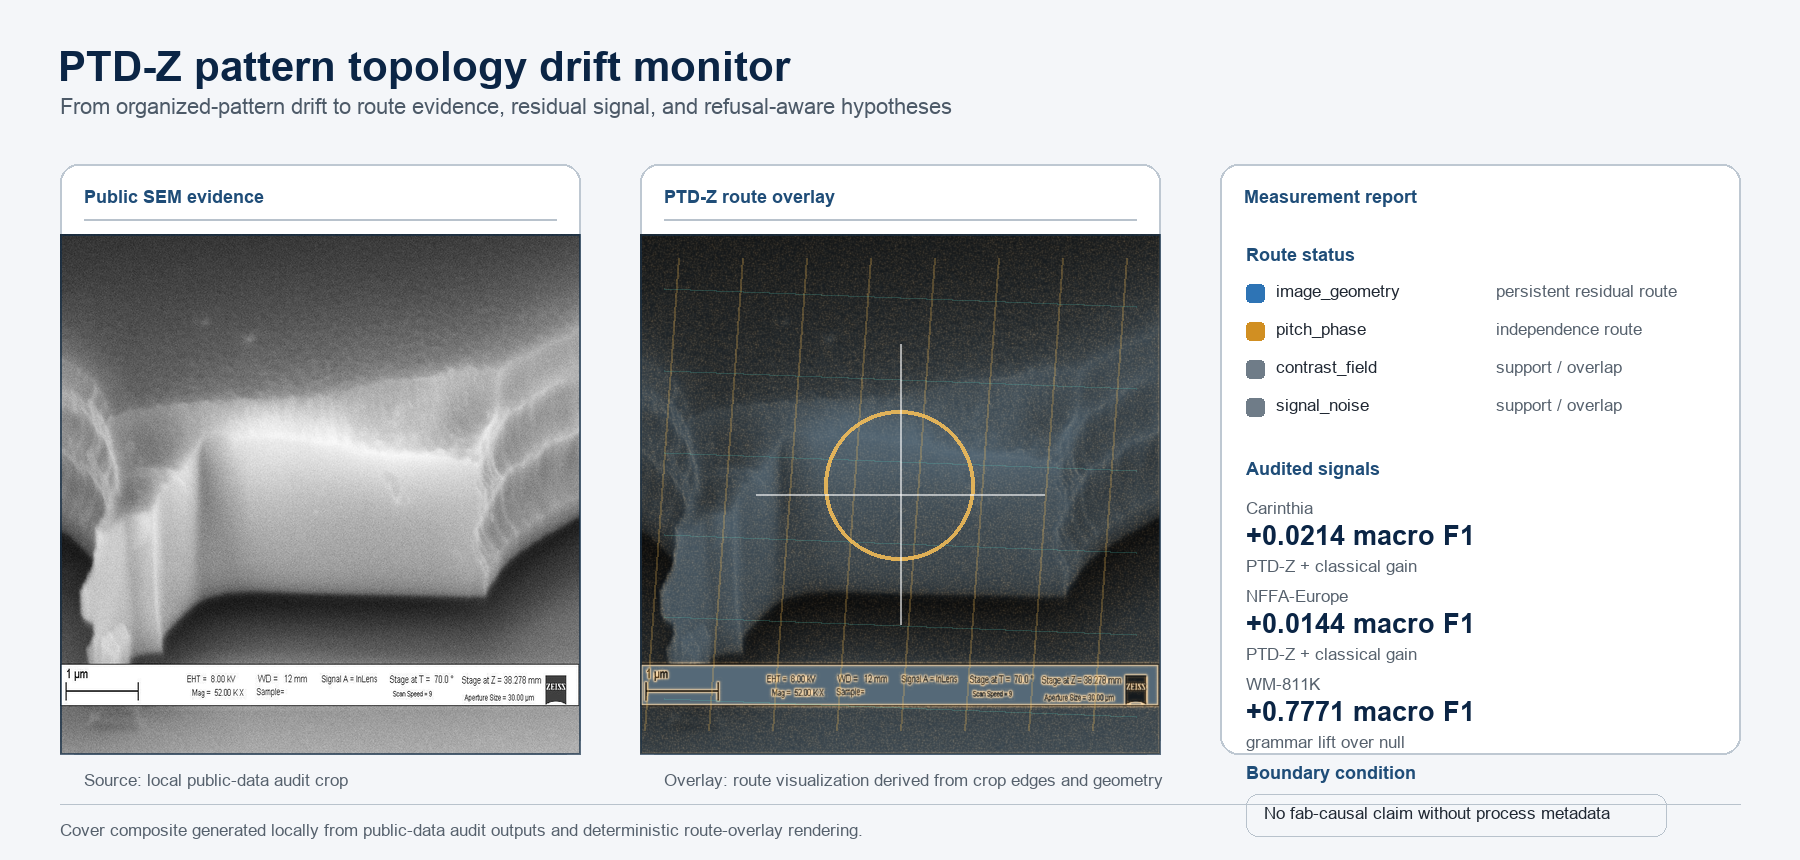
PTD-Z does not replace classical descriptors or inspection tools; it reorganizes image evidence into interpretable routes, tests how much survives classical baselines, and refuses process-causal claims without process-linked data.
Abstract
Semiconductor inspection imagery is often evaluated through classification or generic feature descriptors. Those approaches can detect separation, but they do not necessarily preserve the structural route by which an image changed. PTD-Z is a deterministic Pattern Topology Drift Monitor that asks whether an organized pattern has stopped behaving like the structure it was expected to be. Its mechanism is routed structural telemetry: image geometry, pitch/phase, material topology, contrast field, gradient activation, signal/noise, and residual/support evidence.
The current public evidence supports a bounded claim. PTD-Z is not fundamentally separate from classical descriptors, and several route families are substantially reconstructable from classical features. However, NIST Set6 ablations show that image geometry and orientation topology track U-Net Dice degradation much more strongly than residual-only coordinates, which argues that the signal is not merely absolute differencing. Carinthia and NFFA-Europe audits then show partial independence and hybrid complementarity against Hu moments, Zernike moments, GLCM/Haralick-style texture, HOG, and LBP.
On the balanced Carinthia semiconductor SEM defect audit, adding PTD-Z_All to Classical_All improves macro F1 by 0.0214; a separate 12-seed balanced sensitivity pass centers PTD-Z 42 at 0.9239 ± 0.0164, Classical_All at 0.9165 ± 0.0105, and Hybrid 42 at 0.9330 ± 0.0106. Therefore the standalone Carinthia gap is treated as slice-sensitive, while the stronger claim is hybrid lift and route-level residual contribution. The cleanest residual Carinthia routes are image geometry and pitch/phase. Across both semiconductor-specific defects and broad SEM morphology, the strongest audited systems were hybrid combinations of PTD-Z and classical descriptors, suggesting that structural organization provides residual information not fully captured by texture-, moment-, or edge-based feature families. The remaining causal question cannot be settled with public image classes alone; it requires a same-sequence process dataset with known focus, dose, etch, overlay, chamber, maintenance, or timestamped drift.
1. Problem and Contribution
The practical inspection problem is not only whether an image is unusual. It is whether the pattern has stopped behaving like the structure it was supposed to be, and whether the unusual evidence can be translated into a reviewable structural statement. A single texture, shape, or confidence score can flatten different causes into the same number. PTD-Z tries to preserve the structural sentence behind the measurement: this looks geometric, this looks pitch/phase related, this looks contrast/focus-like, this is only support evidence, or this should not be elevated to a causal claim.
The contribution is not raw descriptor novelty alone. The contribution is topology-drift framing, route decomposition, signal routing, residual testing against classical descriptors, process-hypothesis translation, and refusal logic.
| Layer | What it does |
|---|---|
| Classical descriptors | Measure established shape, texture, edge, and moment statistics. |
| PTD-Z drift routes | Group measurements into structural families and report envelope breach, overlap, lift, support evidence, and refusal conditions. |
| Hybrid system | Combines classical feature strength with PTD-Z route interpretation. |
2. Method Overview
PTD-Z extracts deterministic coordinates and groups them into route families. The route families are not treated as magic primitives. They are treated as auditable evidence channels whose usefulness depends on the dataset, the target, and the null controls.
Envelope scoring z-scores each feature against a baseline mean and standard deviation, computes Euclidean distance from the baseline centroid in z-space, and normalizes by the baseline 95th-percentile radius. This is a diagonal-covariance, axis-aligned Mahalanobis-like assumption rather than a full covariance estimate; it is used deliberately because small baseline sets make full covariance estimates fragile. In the pitch/phase route, phase_break_score = (1 − fft_pitch_anisotropy) × fft_ring_entropy. autocorr_lattice_coherence is computed as mean(top autocorrelation peak values) divided by std(top peak values) + abs(mean(top peak values)), with a small epsilon for numerical stability; it is therefore a stability-weighted autocorrelation peak score rather than a direct physical lattice constant.
| Route family | Interpretation |
|---|---|
| image geometry | centroid, radial, shape, and displacement structure |
| pitch/phase | periodicity, lattice coherence, phase breaks |
| material topology | mass, components, skeleton, branches |
| contrast / gradient | local contrast, shading, edge activation |
| signal/noise | denoise residuals and edge retention |
| residual/support | reference residual and auxiliary evidence |
3. Evidence Summary
| Evidence layer | Scale |
|---|---|
| NIST SEM degradation | 3,402 images |
| Carinthia SEM defects | 4,591 images; balanced n=220 |
| Carinthia independence audit | 220 balanced images |
| NFFA-Europe SEM | 1,000 images |
| WM-811K wafer maps | 4,149 maps |
| Synthetic causal hardening | 558 challenge images |
| Physical-sequence scaffold | 20 synthetic focus-sequence samples |
3.1 Findings Emerging From the Current Evidence
The current evidence is not only a set of benchmarks. It suggests several recurring structural findings that should guide the next phase.
| Finding | Evidence | Consequence |
|---|---|---|
| image_geometry is the most consistent residual PTD-Z route | Carinthia gain 0.0252 in the single independence-audit protocol; 12-seed sensitivity mean +0.0135. NFFA gain 0.0132. | Across semiconductor-specific and broad SEM morphology audits, image geometry contributes the largest residual lift after Classical_All; magnitude depends on protocol and seed/slice. |
| hybrid systems win across regimes | Carinthia hybrid gain 0.0214; NFFA hybrid gain 0.0144 | Different descriptor families dominate different image regimes, but combined organization is stronger than either family alone. |
| no descriptor family dominates both domains | Carinthia sensitivity: PTD-Z 42 0.9239 vs Classical_All 0.9165; NFFA: PTD-Z_All 0.5843 vs Classical_All 0.6236 | This is evidence against a universal descriptor and for regime-sensitive, hybrid measurement. |
| PTD-Z appears domain-sensitive | PTD-Z leads on semiconductor-specific Carinthia but trails Classical_All on broad NFFA morphology | The framework appears strongest when imagery contains stable organizational structure rather than unconstrained morphology. |
| route roles are becoming stable | image_geometry and pitch_phase repeatedly survive; contrast and signal/noise drift toward support/overlap roles | The decomposition appears internally coherent rather than a one-off scoreboard artifact. |
| refusal logic is a methodological contribution | support-route split, null controls, lookalike tests, selected-route guards, and broad-route suppression | The workbench asks not only what it can say, but what it should refuse to say. |
| the strongest evidence is residual organizational signal | PTD-Z_All is not always the standalone winner; residual lift after Classical_All is the more durable signal | This frames PTD-Z as structural telemetry rather than as another descriptor benchmark entrant. |
3.2 Route Stability Snapshot
| Route | Carinthia |
|---|---|
| image_geometry | survives |
| pitch_phase | survives |
| contrast_field | overlap/support |
| signal_noise | overlap |
| residual_only | weak |
3.3 Claim Ladder
| Claim layer |
|---|
| SEM degradation telemetry |
| SEM defect-class signal |
| Partial descriptor independence |
| Hybrid complementarity |
| Route-role stability |
| Process-hypothesis generation |
| Process causality |
| Fab deployment |
4. Pattern Topology Drift Evidence
4.1 NIST SEM Degradation and Envelope Breach
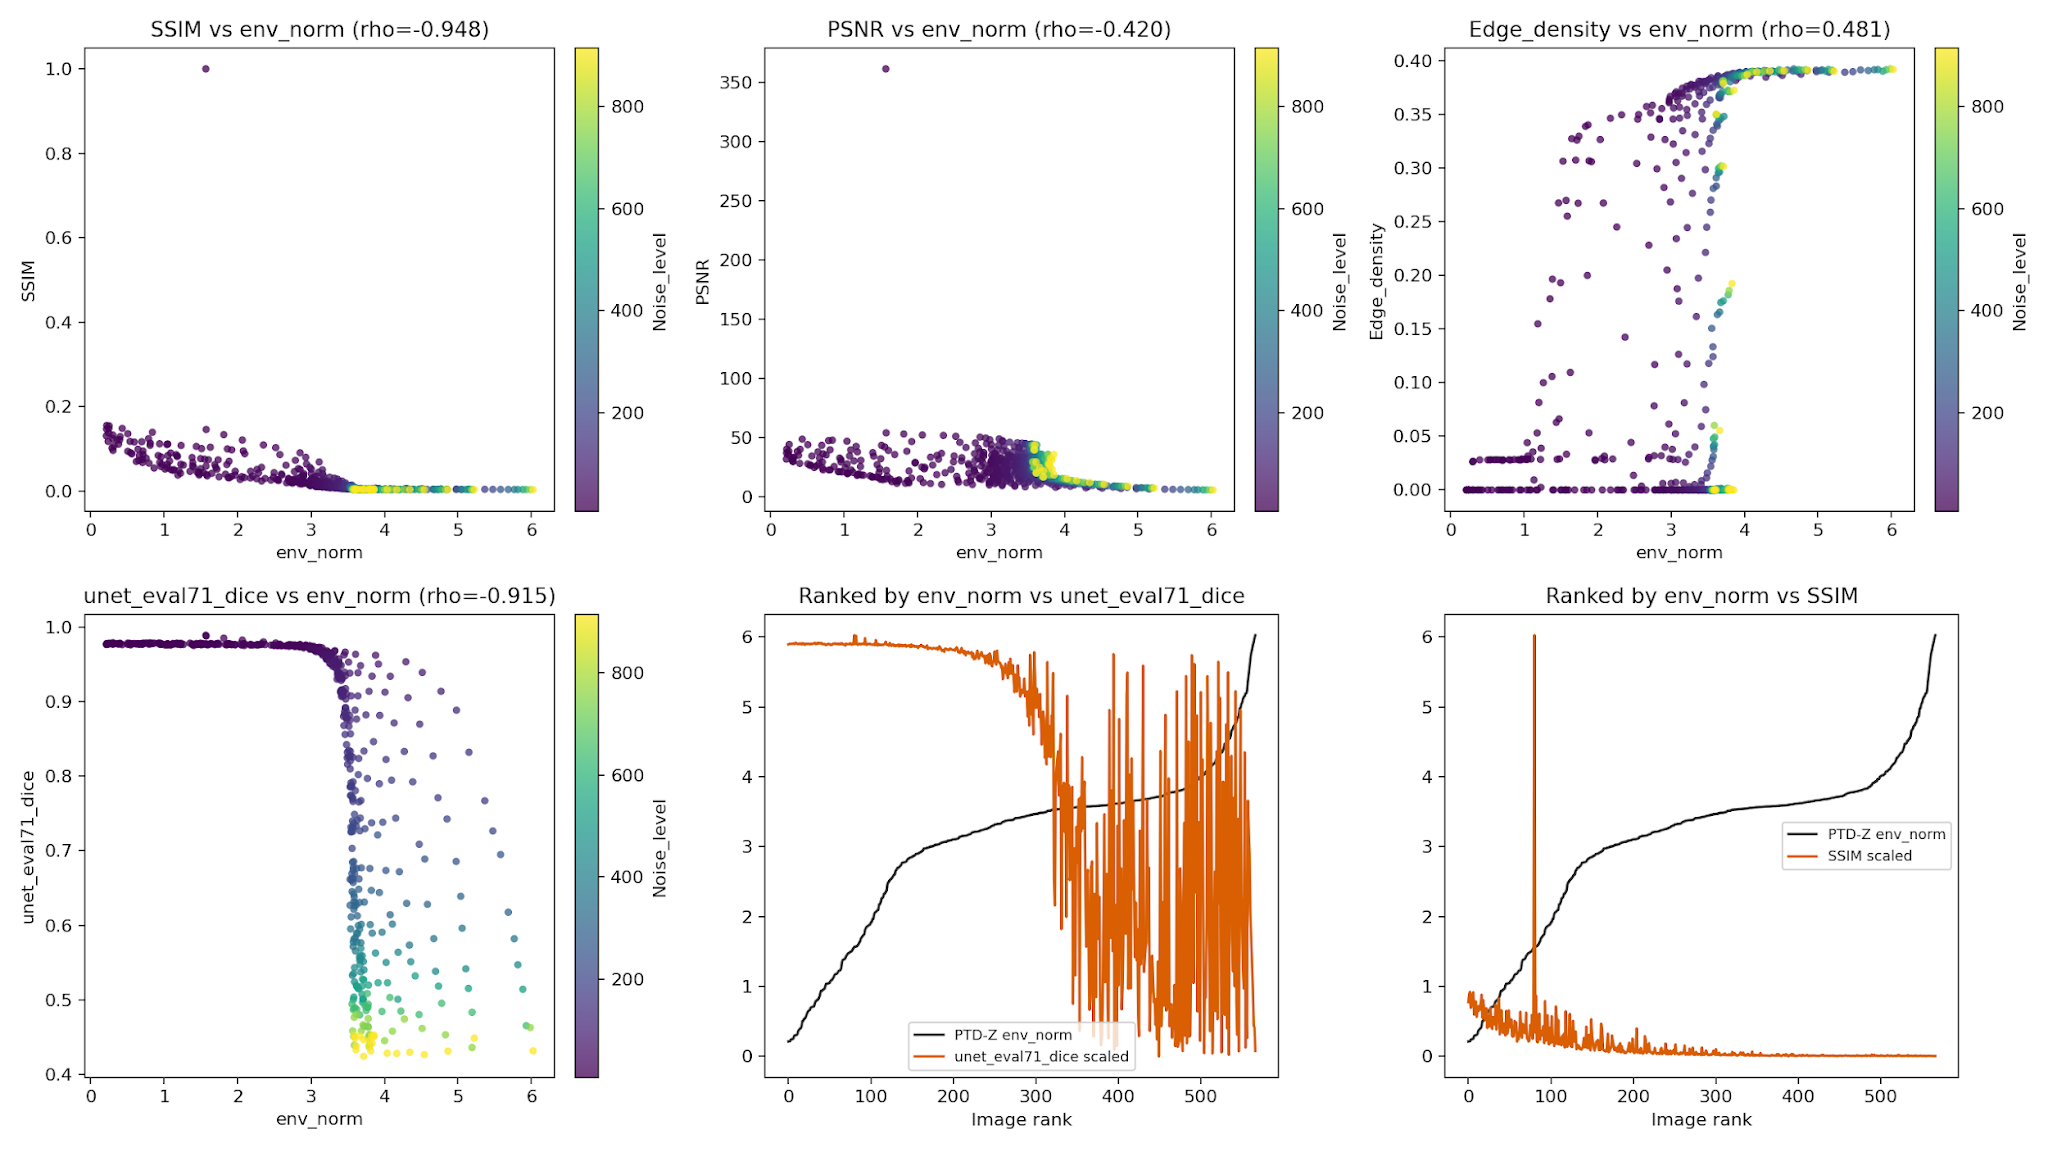
The NIST Detection Limits for SEM Image Segmentation dataset contains simulated SEM image collections with Poisson noise, contrast variation, masks, image-quality metrics, and U-Net accuracy metrics. The all-set PTD-Z run covers 3,402 images and reports a non-baseline breach ratio of 0.9477. This supports pattern-topology drift tracking, not production fab readiness. The useful question is not only whether an image degrades, but which structural route explains the degradation and when the route should refuse a stronger interpretation.
| NIST signal | Value |
|---|---|
| all-set images | 3,402 |
| baseline rows | 72 |
| non-baseline breach ratio | 0.9477 |
| SSIM Spearman vs env_norm | −0.7627 |
| PSNR Spearman vs env_norm | −0.5540 |
| set6 U-Net eval51 Dice vs env_norm | −0.9184 |
4.2 Internal Validity: Not Just Residual Difference
A key antithesis is that PTD-Z may simply be measuring absolute residual difference from a reference. The NIST Set6 ablation pushes back on that explanation. If residual differencing were the main story, residual_only should dominate the U-Net Dice relationships — it does not. This negative result is more important than it may first appear. One of the most direct alternative explanations for PTD-Z is that it functions primarily as a residual-difference detector. If that explanation were sufficient, residual_only should dominate the segmentation-stress relationships on the NIST Set6 slice. Instead, image_geometry, orientation_topology, pitch/phase, and gradient_activation all substantially outperform residual_only. The implication is not that residual information is unimportant, but that topology-drift behavior cannot be reduced to residual differencing alone. The strongest route signals appear to preserve aspects of organization, periodic structure, and geometric arrangement that survive beyond simple image-to-reference error.
| Feature group | Count | SSIM rho | eval51 Dice rho |
|---|---|---|---|
| all features | 16 | −0.9485 | −0.9184 |
| image geometry | 13 | −0.9323 | −0.9781 |
| orientation topology | 5 | −0.9130 | −0.9565 |
| gradient activation | 3 | −0.8926 | −0.9243 |
| pitch / phase | 10 | −0.9266 | −0.9705 |
| residual only | 3 | −0.6091 | −0.4538 |
| contrast field | 11 | −0.7037 | −0.5005 |
| geometry + contrast | 24 | −0.7905 | −0.6243 |
| signal / noise | 4 | −0.7929 | −0.6185 |
The strongest NIST Set6 topology signal is not residual_only. image_geometry, orientation_topology, pitch/phase, and gradient_activation carry stronger U-Net Dice relationships, which supports the route-decomposition argument.
4.3 Signal Router: Task-Specific Channel Specialization
The route grammar becomes more concrete when treated as a signal router rather than one universal score. Different targets select different channels: periodic segmentation stress selects geometry plus pitch/phase, SSIM-like degradation selects gradient activation, and PSNR selects residual/pixel-fidelity evidence. Thin routing margins are not hidden; they become refusal or caveat signals.
| Target | Selected channel | Runner-up | Margin | Confidence |
|---|---|---|---|---|
| U-Net eval51 Dice | geometry + pitch/phase | image geometry | 0.0042 | thin |
| SSIM | gradient activation | geometry + signal/noise | 0.1581 | high |
| PSNR | residual only | contrast field | 0.0446 | thin |
4.4 Contrast-Field Antithesis
The contrast-field pass is a useful negative result. Contrast and slow-field coordinates are real measurements, but adding them to the topology envelope can weaken the U-Net Dice relationship. On NIST Set6, geometry_plus_contrast_field is much weaker against eval51 Dice than image_geometry alone. This is why contrast_field is treated as a support/refusal route rather than automatically mixed into the primary topology score.
| Comparison | eval51 Dice rho |
|---|---|
| image geometry | −0.9781 |
| contrast field | −0.5005 |
| geometry + contrast | −0.6243 |
| residual only | −0.4538 |
5. Classical Descriptor Context
The NIST route findings do not make classical descriptors irrelevant. The descriptor comparison is deliberately narrower: it asks how PTD-Z routes sit beside Hu, Zernike, GLCM/Haralick, HOG, and LBP features. No deep-learning baseline is included in this packet. A fine-tuned CNN or foundation-vision model may outperform PTD-Z on raw Carinthia defect classification; this paper does not test that question and therefore makes no claim of classification superiority over deep learning. The relevant comparison is whether routed structural coordinates provide interpretable residual evidence, refusal logic, and process-facing hypotheses that remain useful beside learned models.
| Target | Best group | Best feature | Best abs rho | Zernike abs rho |
|---|---|---|---|---|
| Edge_density | ptdz contrast | local contrast mean | 0.9502 | 0.5949 |
| PSNR | ptdz contrast | intensity std | 0.9997 | 0.6966 |
| SSIM | classical lbp | lbp bin 09 | 0.9442 | 0.8952 |
| unet_eval31_dice | ptdz gradient | gradient ceiling 97 | 0.9472 | 0.9250 |
| unet_eval51_dice | ptdz pitch phase | fft pitch peak ratio | 0.9896 | 0.9467 |
| unet_eval71_dice | ptdz pitch phase | fft pitch peak ratio | 0.9855 | 0.9501 |
5.1 Carinthia Semiconductor SEM Defects
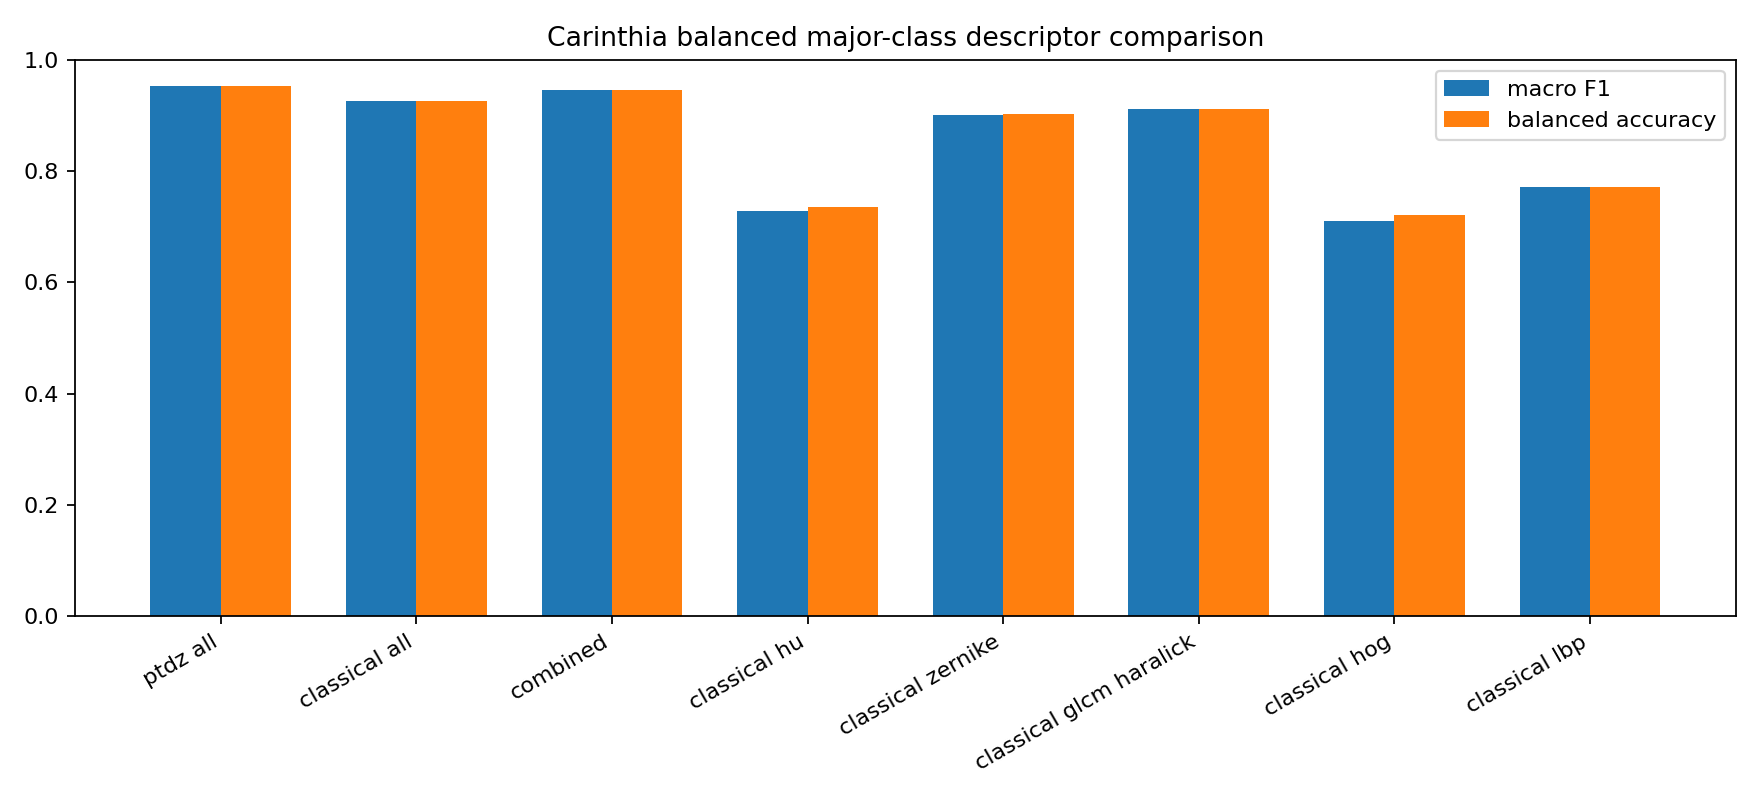
Carinthia is the closest public SEM dataset to the intended semiconductor inspection domain in this packet. It contains 4,591 SEM defect images from one semiconductor production layer, unevenly distributed across six defect classes. The first balanced evaluation uses 220 images from the major classes. This is the maximum balanced four-class slice available in the local table because class 1 contains 55 images; larger Carinthia runs are necessarily imbalanced.
To test whether the favorable standalone descriptor result was carrying too much weight, a 12-seed balanced sensitivity pass was run across repeated 55-per-class slices. The result narrows the claim: PTD-Z remains modestly above Classical_All on average, but the stable finding is that hybrid systems are strongest and image_geometry provides the largest route-level residual lift over Classical_All.
| Carinthia balanced sensitivity group | Macro F1 mean | Across-seed std | Min |
|---|---|---|---|
| Hybrid 42 + Classical_All | 0.9330 | 0.0106 | 0.9138 |
| Hybrid 47 + Classical_All | 0.9304 | 0.0104 | 0.9119 |
| Classical_All + image_geometry | 0.9300 | 0.0101 | 0.9081 |
| PTD-Z audit no-residual | 0.9251 | 0.0148 | 0.9036 |
| PTD-Z audit 47 | 0.9247 | 0.0142 | 0.9053 |
| PTD-Z descriptor 42 | 0.9239 | 0.0164 | 0.9023 |
| Classical_All | 0.9165 | 0.0105 | 0.8985 |
| Hybrid 42 gain over Classical_All | +0.0165 | 0.0101 | +0.0018 |
| image_geometry gain over Classical_All | +0.0135 | 0.0085 | −0.0019 |
| pitch_phase gain over Classical_All | +0.0066 | 0.0046 | −0.0004 |
| Feature group | Features | Macro F1 | Std |
|---|---|---|---|
| ptdz all (single descriptor protocol) | 42 | 0.9531 | 0.0262 |
| combined (single descriptor protocol) | 137 | 0.9454 | 0.0182 |
| classical all (single descriptor protocol) | 95 | 0.9258 | 0.0268 |
| classical glcm haralick | 14 | 0.9120 | 0.0279 |
| classical zernike | 50 | 0.9011 | 0.0296 |
| classical lbp | 19 | 0.7705 | 0.0384 |
| classical hu | 7 | 0.7274 | 0.0496 |
| classical hog | 5 | 0.7110 | 0.0322 |
5.2 NFFA-Europe Broad SEM Morphology
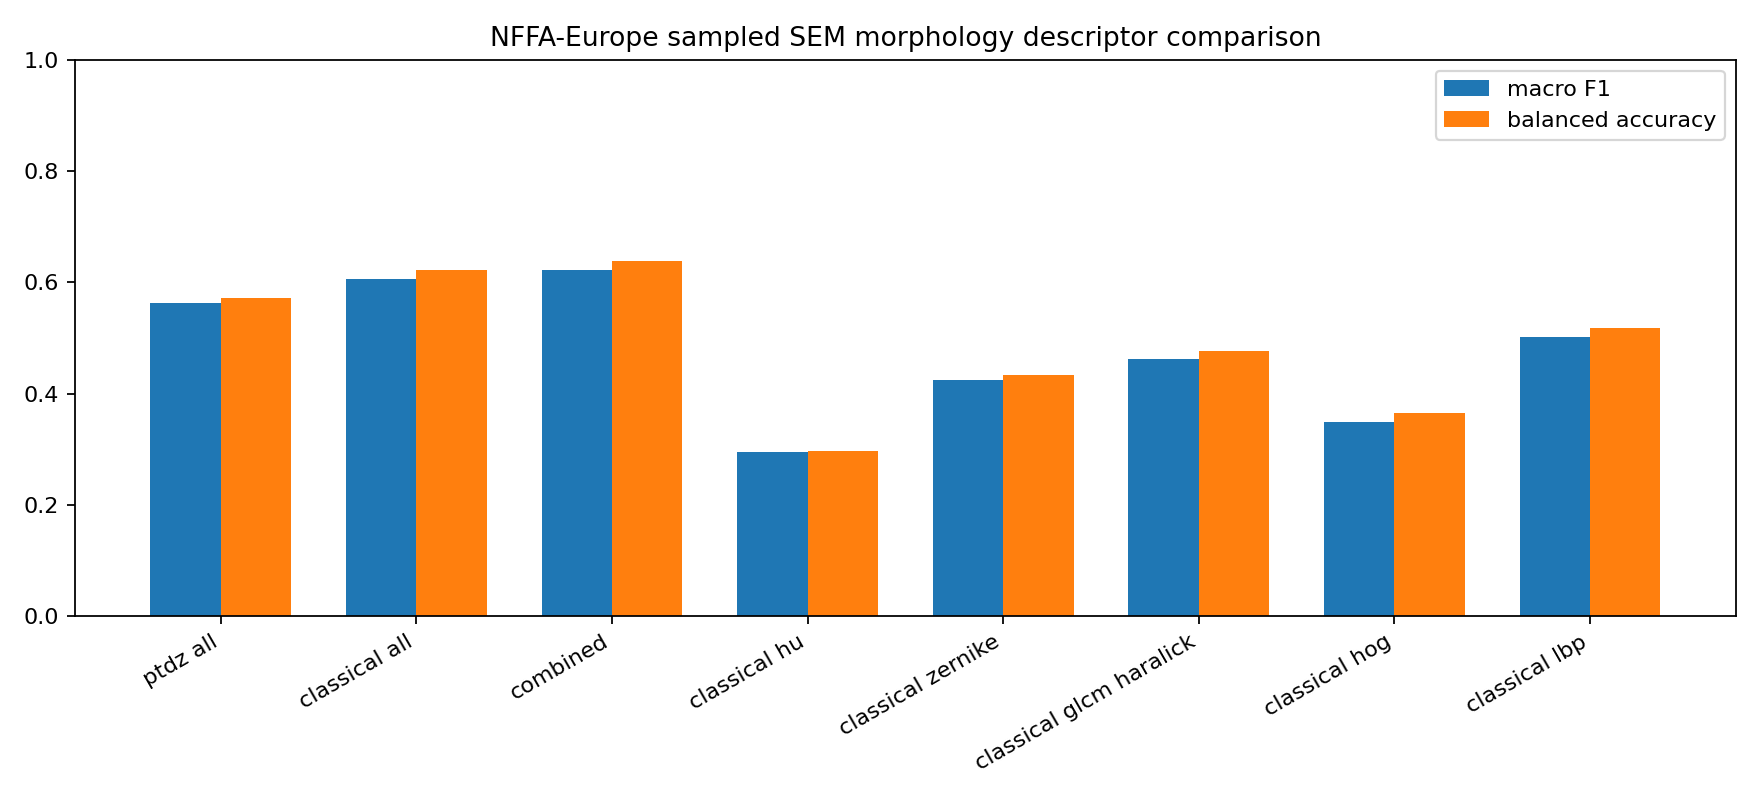
NFFA-Europe is a broad SEM morphology stress test rather than a semiconductor process dataset. It is useful because it asks whether the route language generalizes beyond the structured semiconductor-defect lane. On this broader dataset, classical descriptors are stronger than PTD-Z alone, and the hybrid system is strongest.
| Test | Base macro F1 | Combined macro F1 |
|---|---|---|
| Classical_All + PTD-Z_All | 0.6236 | 0.6380 |
| PTD-Z_All + Classical_All | 0.5843 | 0.6362 |
6. Independence and Recombination Audit
The key question is not whether PTD-Z overlaps classical descriptors. It does. The key question is whether any route family remains useful after classical descriptors are already present. The audit predicts PTD-Z route-family features from Classical_All and then measures residual predictive power when PTD-Z is added to Classical_All.
The strongest evidence is residual organizational signal: PTD-Z adds information after Classical_All in both the semiconductor-specific Carinthia audit and the broader NFFA-Europe SEM morphology audit.
6.1 Carinthia Independence Results
| PTD-Z family | RF R² from Classical_All | Linear R² |
|---|---|---|
| pitch phase | −0.2441 | −1.9609 |
| material topology | 0.6672 | 0.5802 |
| gradient activation | 0.7245 | 0.6157 |
| image geometry | 0.7562 | 0.6932 |
| signal noise | 0.7896 | 0.7409 |
| contrast field | 0.8286 | 0.8135 |
| residual only | 1.0000 | 1.0000 |
| Test | Base macro F1 | Combined macro F1 | Macro F1 gain |
|---|---|---|---|
| Classical_All + PTD-Z_All | 0.9059 | 0.9273 | +0.0214 |
| PTD-Z_All + Classical_All | 0.9106 | 0.9202 | +0.0095 |
Negative reconstruction R² values are possible in cross-validated regression. They indicate that the reconstruction model performed worse than predicting the held-out target-family mean. In this audit, the negative pitch_phase R² values are interpreted as poor reconstructability from the supplied classical descriptor set, not as a scoring bug.
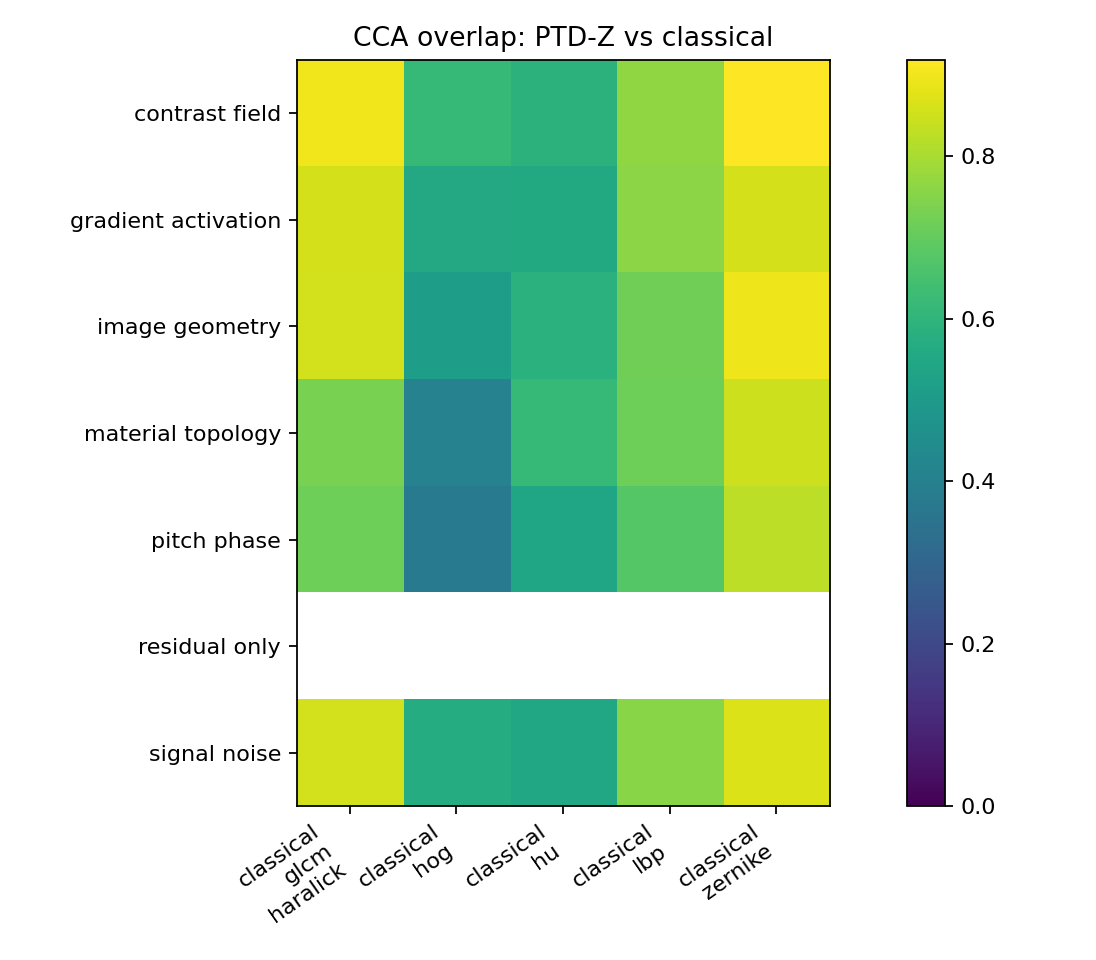
Interpretation: image_geometry has the largest residual Carinthia lift over Classical_All, while pitch_phase has the strongest independence profile and still adds measurable lift. contrast_field is strong alone but negative when added to Classical_All in this audit, so it should be displayed as support evidence rather than a headline independent route on this slice.
6.2 Broad-SEM Boundary Result
| PTD-Z family | RF R² from Classical_All | Linear R² | Macro F1 gain | Read |
|---|---|---|---|---|
| pitch phase | 0.5283 | 0.4775 | +0.0070 | partial independence |
| image geometry | 0.6534 | 0.6244 | +0.0132 | partial independence |
| contrast field | 0.6928 | 0.6526 | +0.0021 | partial independence |
| gradient activation | 0.7684 | 0.7124 | +0.0003 | substantial overlap |
| material topology | 0.8343 | 0.7375 | +0.0078 | substantial overlap |
| signal noise | 0.8995 | 0.8829 | −0.0012 | substantial overlap |
| residual only | 1.0000 | 1.0000 | +0.0061 | largely reconstructable |
NFFA is the useful antithesis. PTD-Z remains complementary, but Classical_All adds more to PTD-Z than PTD-Z adds to Classical_All on broad morphology. That result argues against grand claims and for a hybrid, route-aware system.
6.3 Route-Role Stability
A second-order finding is that the same route families tend to occupy similar roles across audits. This does not prove causal stability, but it does suggest that the decomposition has internal structure: some routes repeatedly carry residual signal, while others repeatedly behave as support or overlap-heavy evidence. If route roles were arbitrary, different families would be expected to emerge as residual contributors on different datasets without a consistent pattern. That is not what appears in the current audits. image_geometry and pitch_phase repeatedly survive as residual or partially independent routes, while signal_noise and residual_only repeatedly drift toward support or overlap-heavy roles.
| PTD-Z route | Carinthia gain |
|---|---|
| image geometry | +0.0252 |
| pitch phase | +0.0091 |
| contrast field | −0.0176 |
| signal noise | 0.0000 |
| material topology | −0.0007 |
| residual only | −0.0048 |
7. Wafer-Map Grammar and Learned-Layer Dialectic
WM-811K is not SEM imagery and does not provide process-cause labels. It is still useful for wafer-level structural grammar: center, donut, edge, scratch, near-full, random, and none-like patterns. The balanced WM-811K run uses 4,149 wafer maps across nine classes.
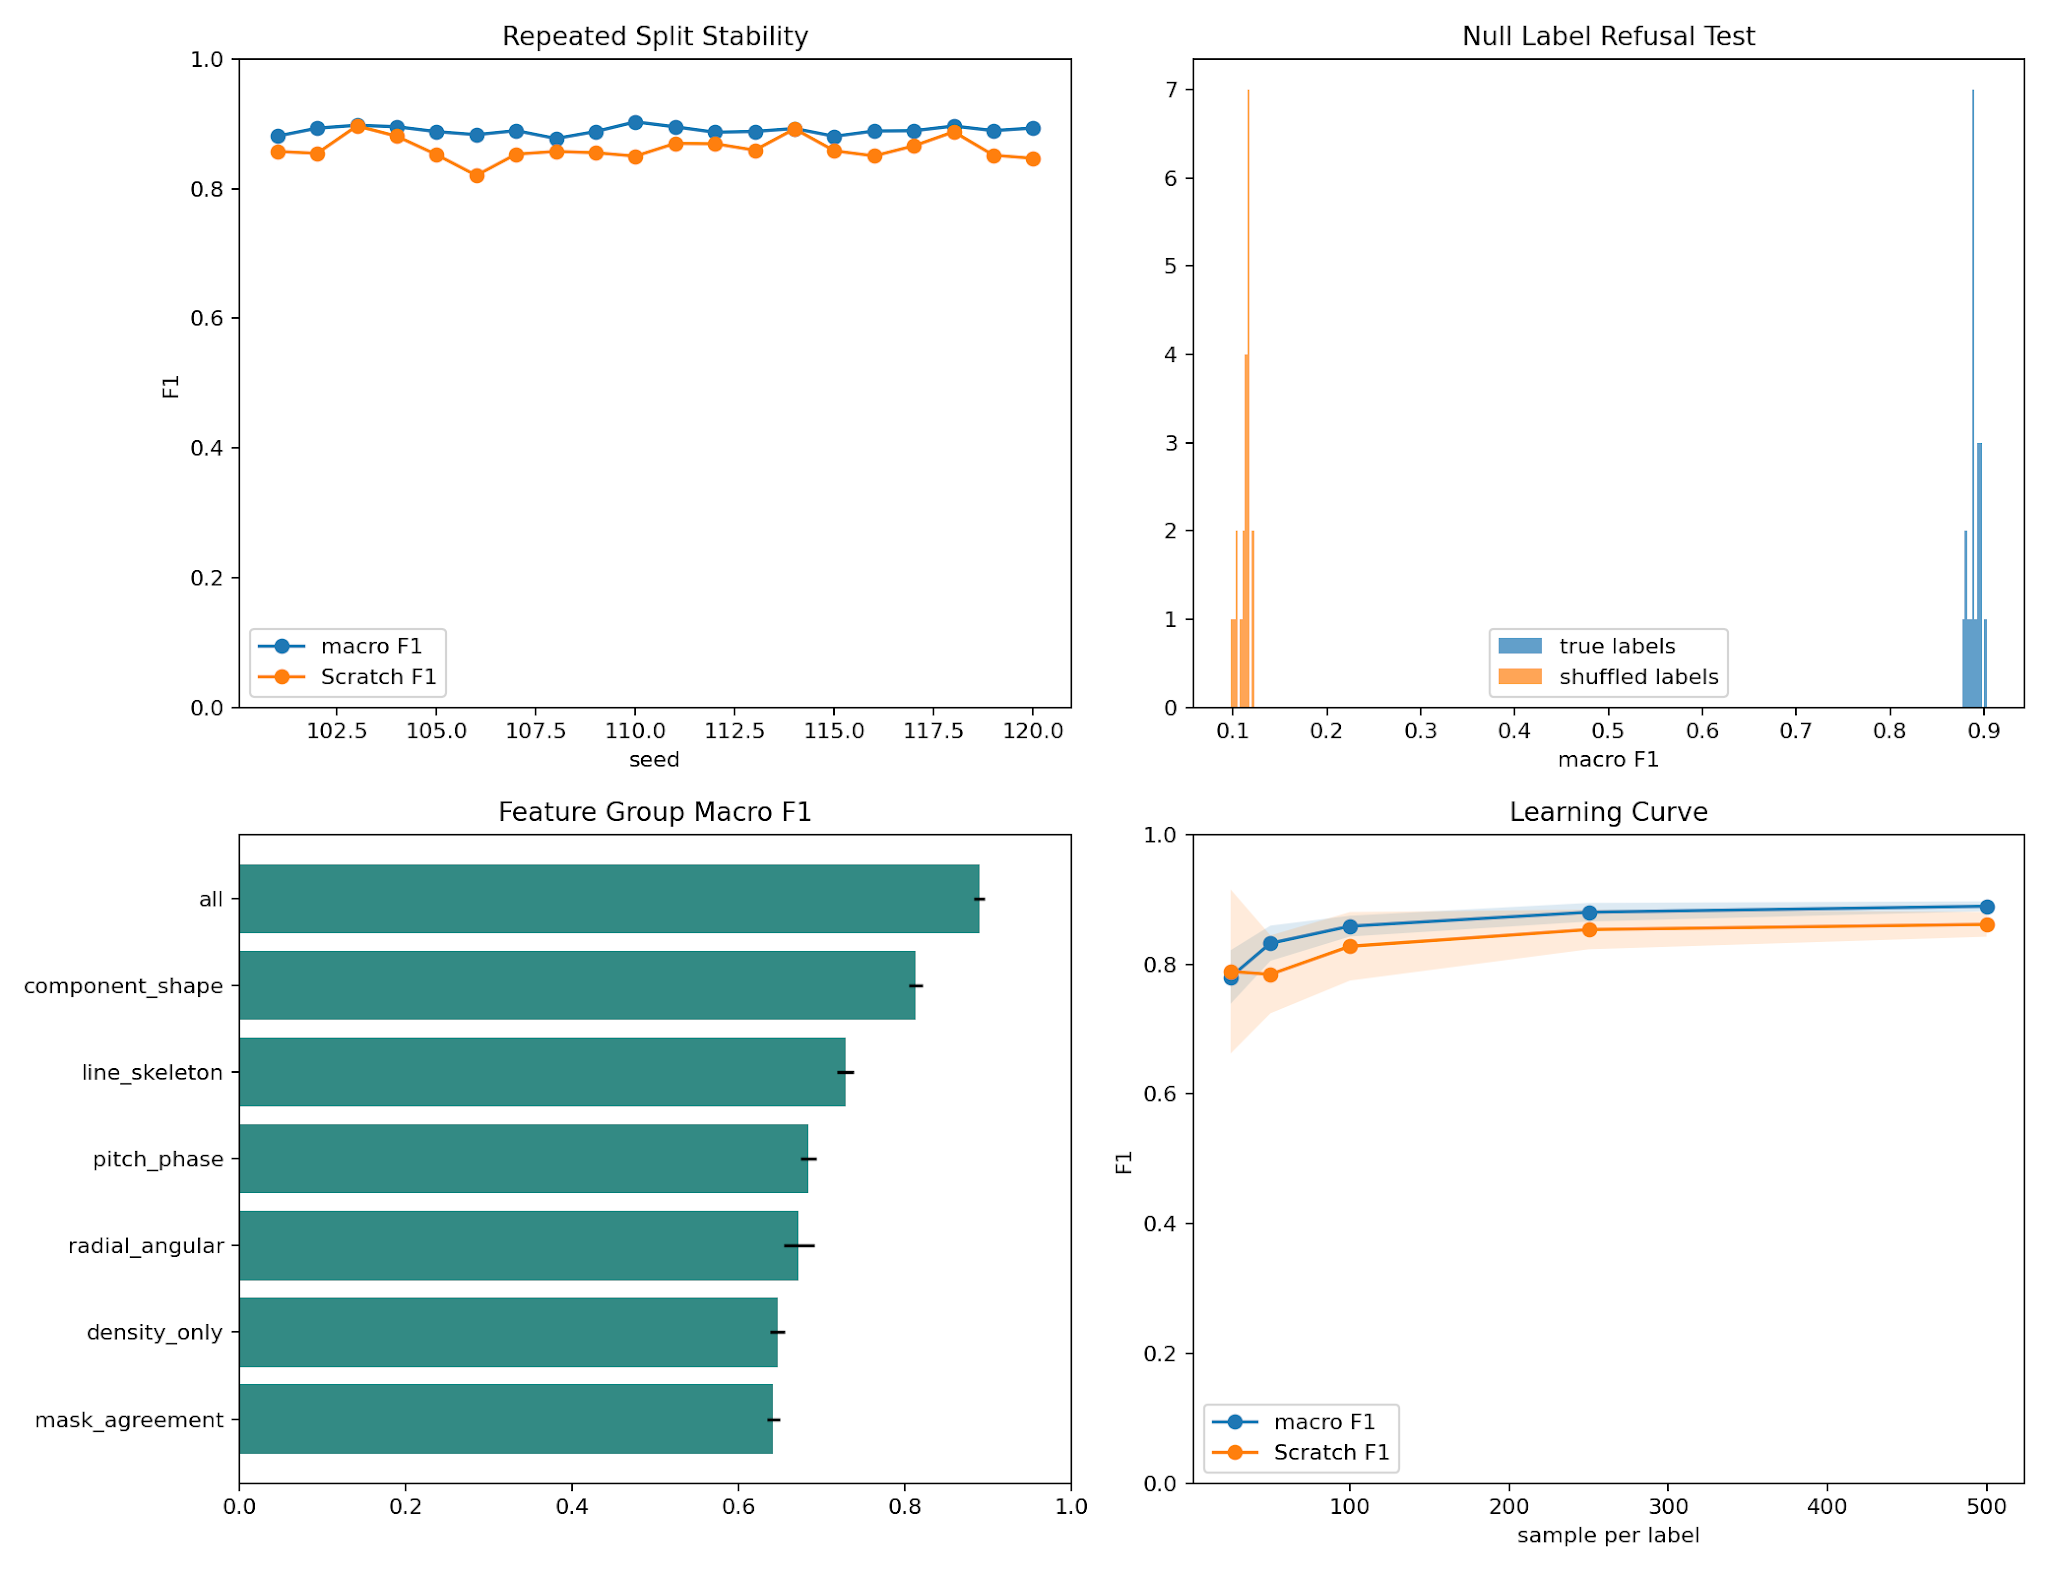
The important result is not raw classification alone. The honest dialectic is that hand grammar alone is brittle, while a constrained learned layer over deterministic coordinates is much stronger. That means the feature language carries real signal, but the product should not depend on hand thresholds when a transparent learned router can expose the same coordinates more reliably.
| Layer | Macro F1 | Accuracy | Weighted F1 |
|---|---|---|---|
| Hand grammar | 0.5609 | 0.5422 | 0.5275 |
| Constrained logistic layer | 0.8859 | 0.8819 | 0.8807 |
| Random forest ceiling | 0.8860 | 0.8787 | 0.8791 |
| Check | Metric | Value |
|---|---|---|
| Repeated splits | macro F1 mean | 0.8897 |
| Repeated splits | macro F1 std | 0.0063 |
| Null labels | macro F1 mean | 0.1125 |
| Lift over null | macro F1 lift | 0.7771 |
| Model ceiling | hist gradient boosting | 0.9087 |
The route-level wafer router also makes the product shape concrete: each target can expose the selected route family, runner-up, margin, and confidence. Thin margins are review signals, not defects to hide.
| Target | Selected route | Score | Runner-up | Margin | Confidence |
|---|---|---|---|---|---|
| overall macro F1 | all | 0.8860 | component shape | 0.0846 | high |
| Donut | radial angular | 0.8785 | component shape | 0.0899 | high |
| Edge-Ring | line skeleton | 0.9333 | component shape | 0.0255 | thin |
| Scratch | line skeleton | 0.7818 | component shape | 0.0094 | thin |
| Random | pitch phase | 0.8919 | density only | 0.0030 | thin |
8. Causal-Hypothesis Workbench
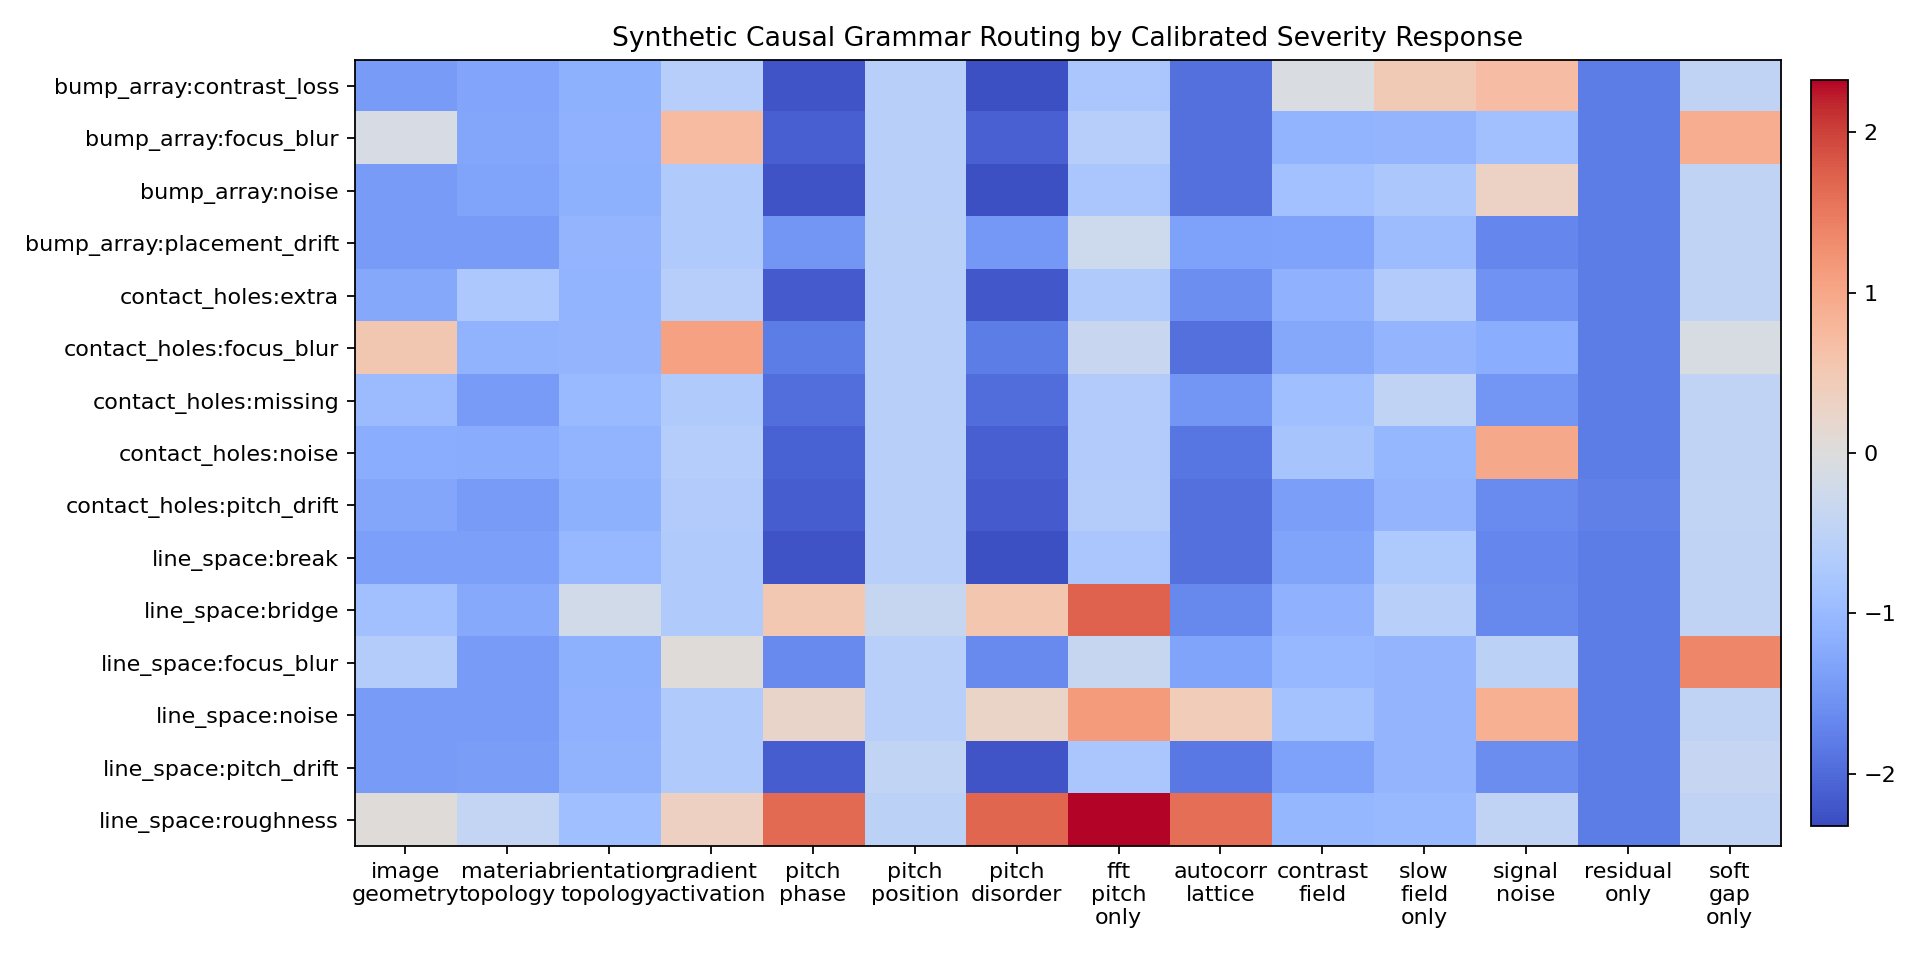
The synthetic causal track is a controlled grammar test and should be read below the public-data evidence, not above it. It does not prove fab causality. It tests whether known perturbation families can be routed, whether lookalikes remain separable, and whether broad support evidence is prevented from becoming a root-cause claim.
This refusal machinery should be treated as part of the method. PTD-Z is designed to separate primary candidates from support evidence, preserve runner-up and antithesis routes, and suppress broad routes from becoming causal headlines without confirming data.
| Metric |
|---|
| challenge samples |
| top-1 route hit |
| top-3 route hit |
| hypothesis-set hit |
| selected overfire |
| broad primary routes |
| broad support routes |
9. Physical-Sequence Gap
The decisive missing evidence is not another generic image benchmark. It is a small process-linked sequence where the process variable or event is known. The built-in focus-sequence demo verifies that the runner can order routes against a known variable and shuffle control, but it is synthetic software validation.
| Candidate sequence | Minimum useful data |
|---|---|
| through-focus SEM stack | 30–100 same-site images |
| dose/focus matrix | 30–100 split-condition images |
| etch/process split | 30–100 before/after or split-lot images |
| overlay/reference pair | 30–100 image/reference pairs |
| maintenance/chamber sequence | 10–50 ordered lots |
| Scaffold metric |
|---|
| demo samples |
| selected primary route |
| selected route rho |
| beats shuffle p95 |
| expected route in top three |
10. Claim Boundary
| Claim | Status |
|---|---|
| PTD-Z detects structural change on public SEM-like data | supported |
| PTD-Z carries real semiconductor SEM defect signal | supported |
| PTD-Z is independent from classical descriptors | partly supported |
| PTD-Z route grammar is meaningful rather than only convenient | suggestive |
| PTD-Z should replace classical descriptors | not supported |
| PTD-Z can infer fab root cause | not proven |
11. Refusal as Measurement Discipline
PTD-Z treats refusal as a first-class method component rather than an afterthought. Each route is evaluated not only by what it can explain, but by when it must remain support evidence, when a primary route is required, when a runner-up should be preserved, and when process-causal language must be withheld.
| Mechanism | Purpose |
|---|---|
| primary/support route split | separates root-cause candidates from auxiliary evidence |
| broad-route suppression | identifies routes that fire across too many perturbations |
| null controls | tests whether route signal survives label or order shuffling |
| lookalike controls | tests nearby explanations such as focus vs. contrast or pitch drift vs. pitch disorder |
| process-linked promotion requirement | requires known focus/dose/etch/overlay/chamber/time metadata before process-causal language is used |
12. Discussion
PTD-Z should be read as a Pattern Topology Drift Monitor and decomposition framework rather than a descriptor replacement. This is a subtle but important difference. A classical descriptor can measure useful image properties; PTD-Z tries to preserve the structural route by which those properties become meaningful for review. The current evidence says that some routes are largely recombinations or support evidence, while others retain residual signal after classical descriptors are already present.
The signal-router result is the most deployable form of the idea. PTD-Z should not produce one universal score and then retrofit an explanation. It should select a channel for the task, expose the runner-up, report the margin, and attach a caveat when the margin is thin or the selected channel is known to be support-heavy.
The most persistent practical finding is image geometry. Pitch/phase provides the cleaner independence story, but image_geometry provides the largest residual contribution after Classical_All in both Carinthia and NFFA audits. That suggests the geometry route may be the most durable near-term PTD-Z contribution, especially when paired with classical texture and moment descriptors.
One possible mechanism is scale and organization. image_geometry aggregates where mass, centroid, radial balance, and shape displacement sit in the image, while many classical texture and moment descriptors summarize local texture, edge energy, or global moments without preserving the same route-level organizational context. This does not make geometry unique or causal. It suggests that geometry may preserve a mesoscale structural coordinate that remains useful after local texture, gradient, and moment information has already been supplied. That would explain why it repeatedly appears as the strongest residual route rather than merely as a standalone classifier feature.
The practical product direction is therefore a route-level reviewer. It should report selected route, runner-up route, margin, route status, classical overlap, process hypothesis, and refusal condition. If a classical descriptor explains the signal better, the system should absorb that fact rather than hide it.
The broader scientific reading is that descriptor families dominate different image regimes, and small balanced public slices can move standalone scores by enough to make a single headline number fragile. PTD-Z's strongest current claim is therefore not standalone classification superiority. It is residual structural organization: a route grammar that helps keep useful measurements from losing their meaning when aggregated, and that improves hybrid systems when paired with classical descriptors.
13. Limitations
- No public dataset in this packet provides direct fab process-cause labels such as focus, dose, etch, chamber, maintenance, or overlay.
- Carinthia is real semiconductor SEM defect imagery, but it is a defect-class dataset, not a known-cause process sequence.
- The Carinthia independence audit uses a 220-image balanced major-class slice. That is enough for an evidence packet, but thin for strong route-stability claims.
- No CNN, ResNet, EfficientNet, or other deep-learning image baseline is included. A fine-tuned learned image model may outperform PTD-Z on raw Carinthia defect classification; the paper makes no claim of classification superiority over deep learning.
- NFFA-Europe is broad SEM morphology, useful for stress testing but not semiconductor process causality.
- WM-811K provides wafer-map grammar, not image-level SEM inspection. It is a modality-transfer and learned-layer dialectic, not primary semiconductor SEM proof.
- Synthetic causal results test route discipline under known perturbations. They are workbench controls, not production root-cause diagnosis.
- Several PTD-Z route families overlap strongly with classical descriptors and should be treated as support evidence unless they add residual value.
- The route grammar may be an effective organizational convention rather than a new natural taxonomy. Larger, process-linked studies are required to distinguish those possibilities.
14. Transparency Appendix
This appendix makes the main design choices and headwinds explicit so the document does not rely on favorable framing.
| Issue | Current disclosure |
|---|---|
| No direct deep-learning baseline on Carinthia | The current packet compares against classical descriptors and constrained tabular models, not a CNN/ResNet/EfficientNet image baseline. |
| Preliminary local PTD-Z timing | 13.29 ms/image on 220 Carinthia balanced images; 75.3 images/sec. |
| Small balanced independence slice | The Carinthia independence and route-stability discussion uses 220 balanced images from the major classes. |
| No production throughput claim | A preliminary local PTD-Z fast extraction timing exists, but it is not a production benchmark. |
| No fab root-cause proof | Public datasets provide degradation, defect class, morphology, and wafer-map labels, not known process causes. |
| Classical overlap is expected | Several PTD-Z routes overlap with texture, moment, edge, and shape descriptors. |
| Balanced slices are not production distributions | Carinthia is evaluated on a balanced major-class subset for fair split stability. |
| WM-811K and synthetic tracks are secondary evidence | WM-811K tests wafer-map grammar and learned-layer brittleness; synthetic causal work tests machinery under known perturbations. |
15. Next Work
The next decisive artifact is a physical-sequence validation packet. The preferred first target is a through-focus SEM stack from a shared nanofab, metrology lab, or process partner: 30–100 images of the same site or repeated pattern with known focus/Z offsets.
| Sourcing path |
|---|
| shared nanofab or user facility |
| university cleanroom with external users |
| contracted staff work |
| process engineer / research lab contact |
References and Dataset Sources
- National Institute of Standards and Technology. Detection Limits for SEM Image Segmentation. data.gov / NIST data portal. catalog.data.gov
- Kofler, C. et al. Carinthia dataset. Zenodo. DOI: 10.5281/zenodo.10715190. zenodo.org/records/10715190
- NFFA-Europe SEM image datasets. Scientific Data and Hugging Face dataset package. nature.com/articles/sdata2018172 and huggingface.co/datasets/l11p/nffa-europe-sem-dataset
- WM-811K wafer map dataset. Kaggle distribution referencing Wu, M.-J., Jang, J.-S. R., and Chen, J.-L. Wafer Map Failure Pattern Recognition and Similarity Ranking for Large-Scale Data Sets. IEEE Transactions on Semiconductor Manufacturing, 2015. kaggle.com
- NIST NanoFab. Center for Nanoscale Science and Technology user facility. nist.gov/cnst
- Princeton Micro/Nanofabrication Center. mnfc.princeton.edu
- CMU Bertucci Nanotechnology Laboratory external researcher access. nanofab.ece.cmu.edu
- UMass Amherst Nanofabrication Cleanroom. umass.edu/ials/nanofabrication
- University of Delaware Nanofabrication Facility. udnf.udel.edu/capabilities
Appendix A. Local Artifacts Used
| Artifact | Path |
|---|---|
| Static report | site/index.html |
| Carinthia audit | outputs/carinthia_independence_audit/summary.json |
| NFFA audit | outputs/nffa_independence_audit/summary.json |
| Validation brief | docs/PTDZ_VALIDATION_BRIEF.md |
| Classical comparison | docs/CLASSICAL_DESCRIPTOR_COMPARISON.md |
| Physical-sequence protocol | docs/PHYSICAL_SEQUENCE_VALIDATION_PROTOCOL.md |
| Sourcing plan | docs/PHYSICAL_SEQUENCE_SOURCING.md |