Mass, Not Subject
Reading AI-Generated Images Through Gradient Fields
The thing you are looking at is not the image. The image is the mass.
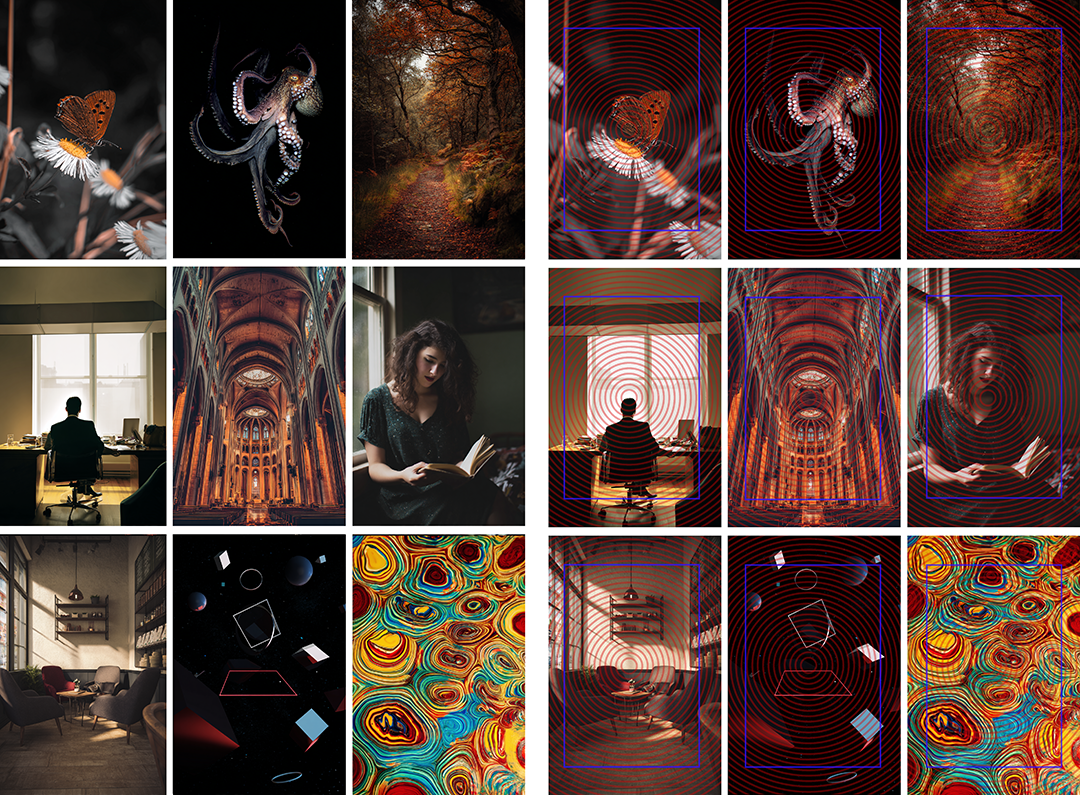
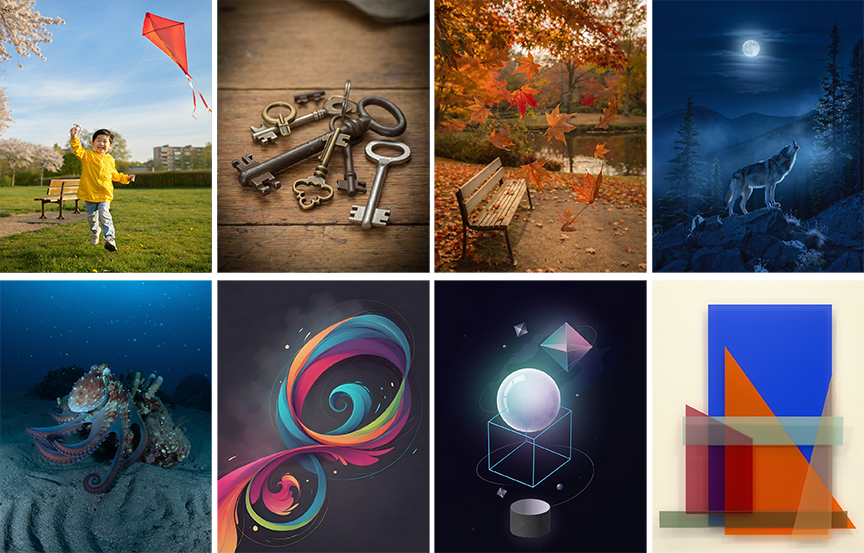
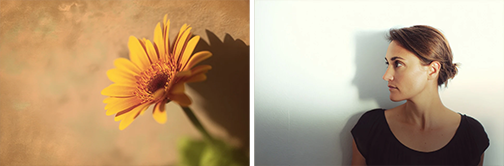
A butterfly. A businessman. A cathedral. A fractal. Most people see subjects. Artists see structure. An image model generating all four is not exercising four compositional strategies, it is applying one template, dressing it in different semantics, and serving the result as variety. Look closer and the seams show: subjects centered, framed in implicit rectangles, angled just enough that each image feels distinct. Small deltas, carefully maintained, so the semantic surface survives inspection while the geometric substrate does not. And that is only what is visible without measurement.
This document bridges the gap between readings. It explains what mass means across three distinct vocabularies between artist, researcher, engineer, and how gradient-field analysis makes the same phenomenon visible and measurable regardless of which language you bring. The underlying claim is simple and empirically supported: semantic diversity does not necessarily produce compositional diversity.
Part 1: Mass
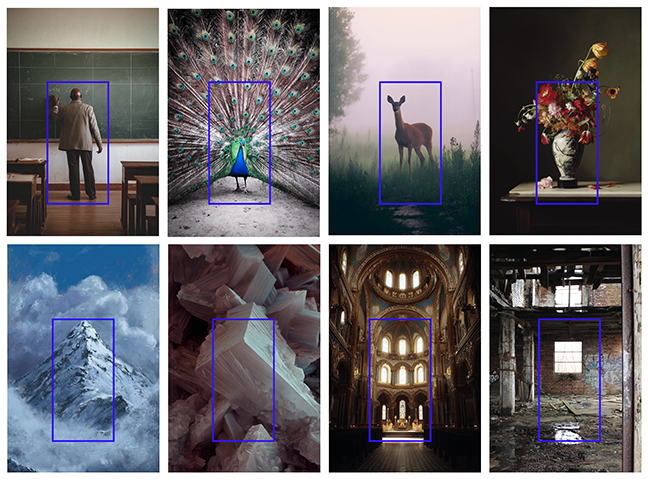
Mass does not mean subject. Mass means regions of rapid visual change: edges, contrast transitions, texture boundaries. The high-gradient zones that define forms, not the semantic objects those forms represent. When this document says 'the mass is centered,' it means the gradient-weighted centroid sits near the frame's barycenter. It does not necessarily mean the object(s) are centered. Those are different things, and the difference is the entire point.
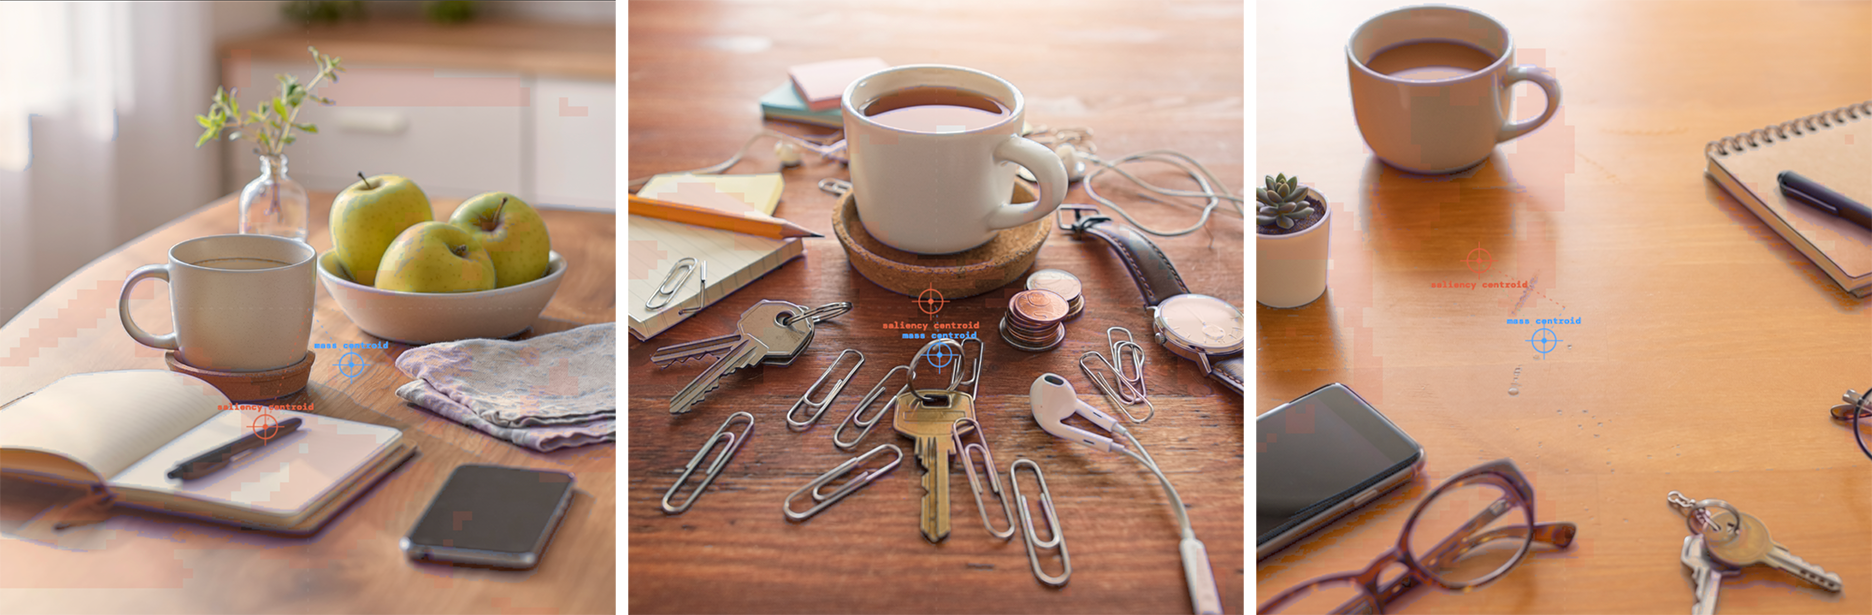
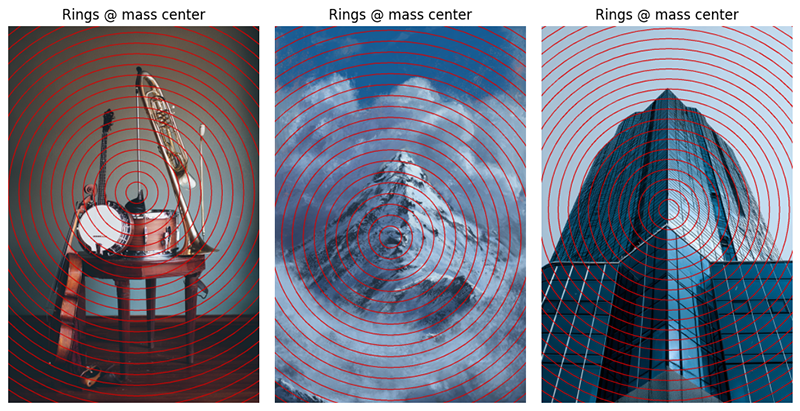
This figure shows three still lifes. The semantic centers are the objects themselves, typically grouped. The structural mass centroid (kernel) is where the gradient energy is. The Sobel operator finds edges, transitions in pixel intensity, and the 85th percentile of that gradient field defines the structural mask. The centroid is the gradient-weighted center of those edge pixels. It answers: where is the structural activity in this image? It doesn't know what anything is. A highly textured background surface will pull the centroid just as hard as a foreground object.
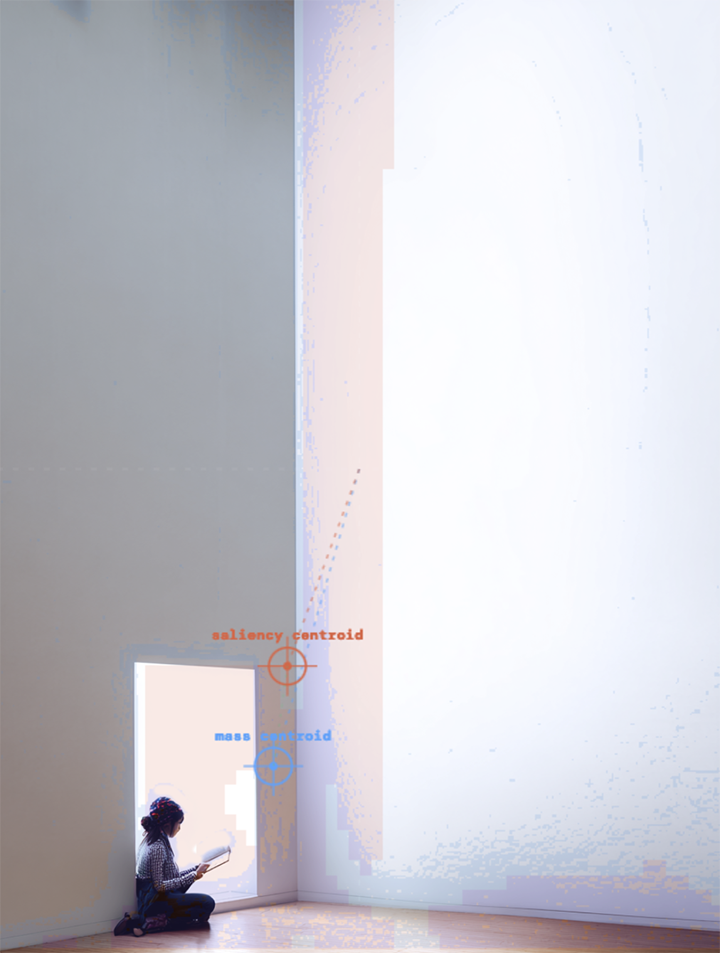
The saliency centroid (spectral residual) is where the image is locally surprising relative to its surroundings. The spectral residual method (Li et al. 2007) computes the difference between the image and a heavily blurred version of itself, then squares it. High values are pixels that contrast strongly against their local context. The centroid is the weighted center of the top 20% of that map. It answers: where does the eye go, what region is visually distinct from everything around it?
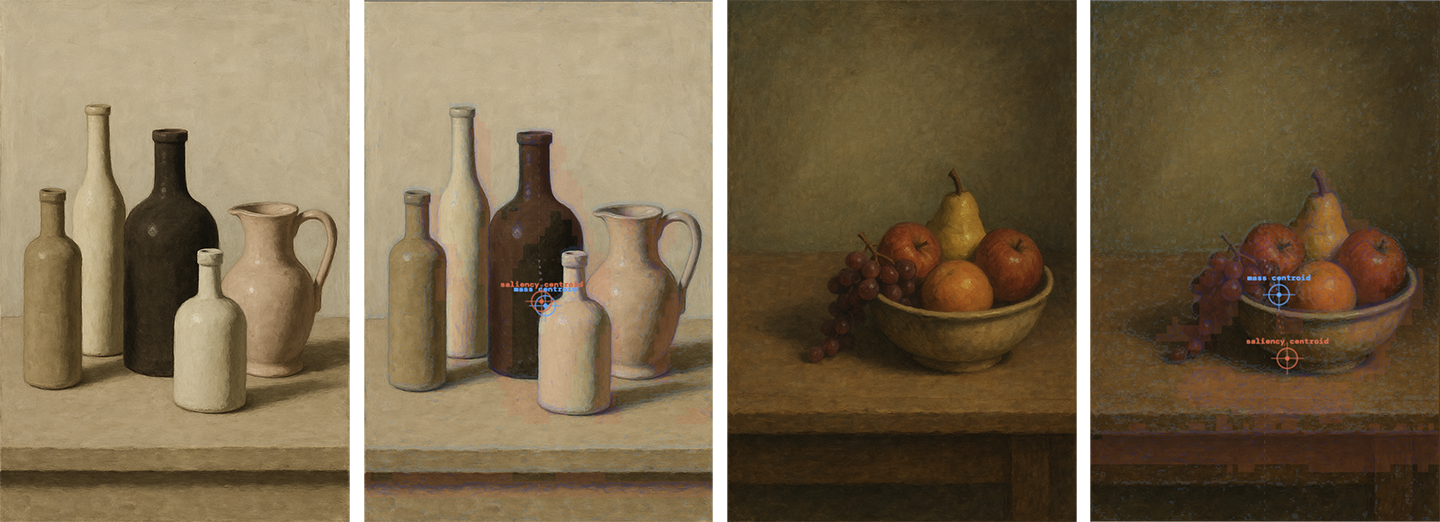
When the centroids are close, structure and visual attention are co-located: the thing to look at is also where the gradient energy is concentrated. That's the normal case for a single isolated object or a set of grouped objects on a ground.
When they diverge, something is happening. Common causes: a highly textured background pulling the structural centroid away from the visually prominent subject; a smooth-surfaced foreground object pulling the saliency centroid away from the structural activity; or a multi-object scene where gradient mass and visual attention are genuinely distributed differently.
Saliency is typically the vehicle of study in AI image analysis, frequently described as representing the "focal point" of model decision-making or human attention. However, saliency is the weighted average of pixel gradients with respect to model outputs, it requires access to the network's internal activations and propagates backward through the decision pathway. It answers: what drove the model to this classification or generation choice? It is introspective. It is semantic. And it collapses to a point.
Whereas the kernel calculates mass through the XY distribution of gradient magnitude in the rendered output itself, no model access required, no decision pathway, no backward propagation. It asks a different question: where does the visual weight of this image resolve, and how is that weight distributed across the full frame? Not a focal point but a field. Not where the model looked, but where the image's own physics settled.
The distinction matters in one precise way: saliency, by design, confirms the centering bias rather than measuring it. If you ask "where did the model attend?", you will find the center, because that is where semantic priority lives and where the radial attention prior concentrates energy simultaneously. The two signals are entangled. Saliency cannot separate them.
The kernel separates them by never asking about the model at all. Delta x = 0.005 is not a claim about model attention. It is a claim about where the gradient-weighted centroid of the final image resolves. Those are measurably different things, and the difference is what makes the kernel capable of detecting the compositional prior that saliency, by its own construction, is constitutionally unable to see.
Saliency maps the decision. The kernel maps the image, as the image was already decided.

The kernel-saliency gap is not just a measurement artifact, it is a behavioral signature. When the two centroids are close, structure and attention are co-located: the image is organized around a single dominant mass, and the eye goes exactly where the gradient energy concentrates. When they diverge, something more complex is happening. But the gap itself, measured consistently across a corpus, tells you something about what a model was optimized for.
Firefly's outputs, across the tested corpus, showed a persistently low gap. Arguably not because of compositional sophistication, but because the images are sparse edge fields with dominant focal clusters positioned in the lower portion of the frame. Structure and attention agree because both are pointing at the same isolated subject against a clean, low-gradient ground. This is a recognizable compositional grammar: editorial product photography, marketing hero shots, stock imagery built for text overlay in the upper register. The kernel-saliency alignment is not evidence of spatial range. It is evidence of a very specific, very narrow target use case, reproduced with high consistency.
Where MidJourney's signature is radial collapse toward center, Firefly's signature is focal-bottom with void above. Different attractor basin. Same fundamental constraint: one template, many subjects, no forbidden zones attempted.
As one can see, the object that draws the eye is also where the edges are, which are not offset. Firefly, within tested corpus without adversarial prompting, showed a tendency for low placement.
Mass as Common Vocabulary
The three vocabularies describing this phenomenon converge on the same structure, which is why we study it over semantics or aesthetics, they avoid traps of judgements, following artistic intent through engineer: the mass can be an agreed truth in composition as it relates to a focal point within the spatial field:
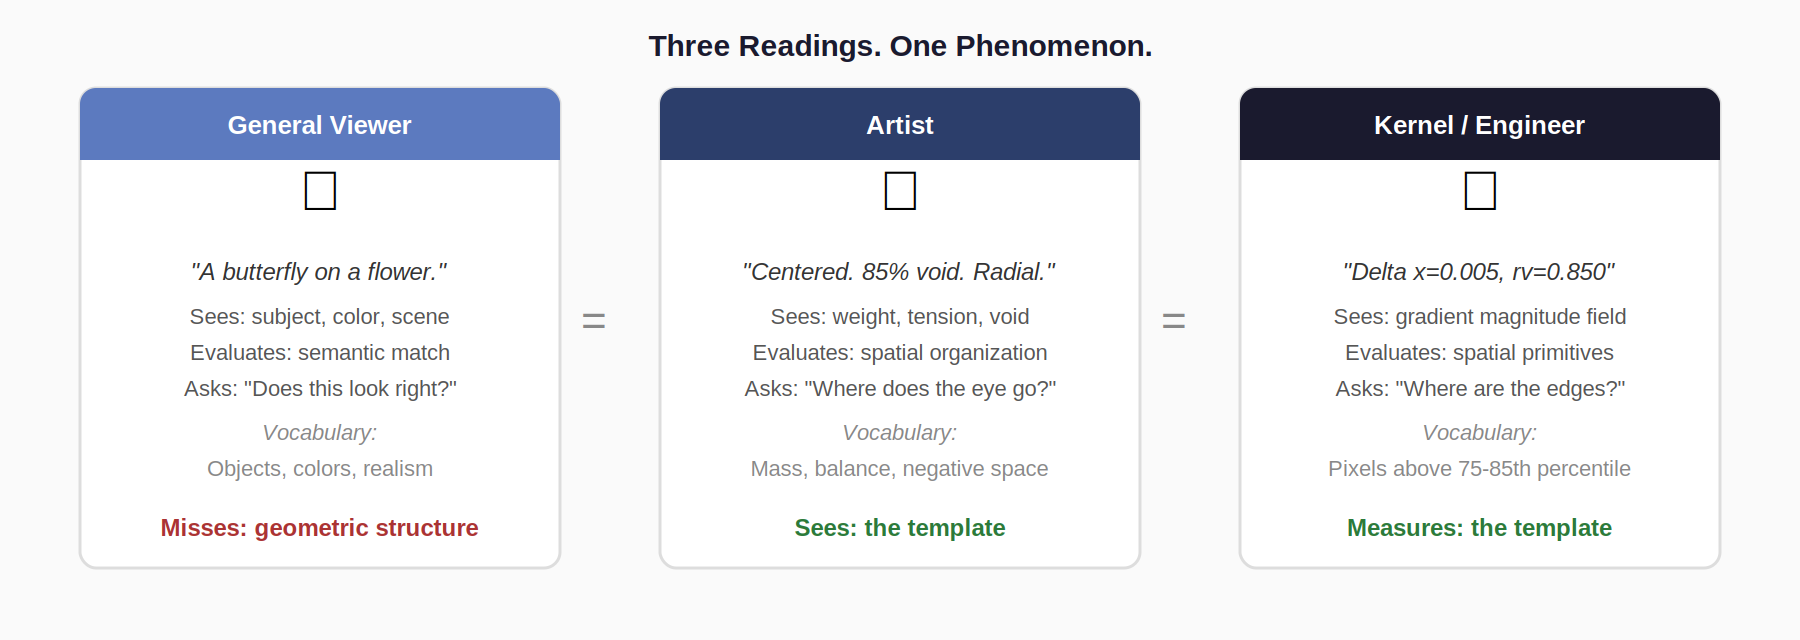
In this context, mass can dress itself in a variety of artistic outputs, coherent structure, energetic states, statistical equilibrium, dispersion, surface texture. Structure survives semantics while occupancy, field, and centroid distributions remain.
For artists: mass is visual weight. Dark shapes, bright highlights, hard edges, textured areas that pull the eye. Not objects, but contrast boundaries. A standing figure's mass includes its shadow, the tonal relationships between figure and background, the edge where light meets dark. When an experienced painter says 'this image is centered,' they're describing where the optical weight resolves, not where the subject sits.
For researchers: mass is high-gradient regions in the luminance field. Areas where pixel values change rapidly: edges, contrast transitions, texture boundaries. This is the same phenomenon the artist perceives, described in spatial frequency terms.
For engineers: mass is pixels above the 75th–85th percentile of gradient magnitude after Sobel filtering. The specific locations where the model placed sharp transitions. Same structure, quantified.
Mass = regions of rapid visual change. Where the image has structure rather than emptiness. This is the skeleton, not the skin.
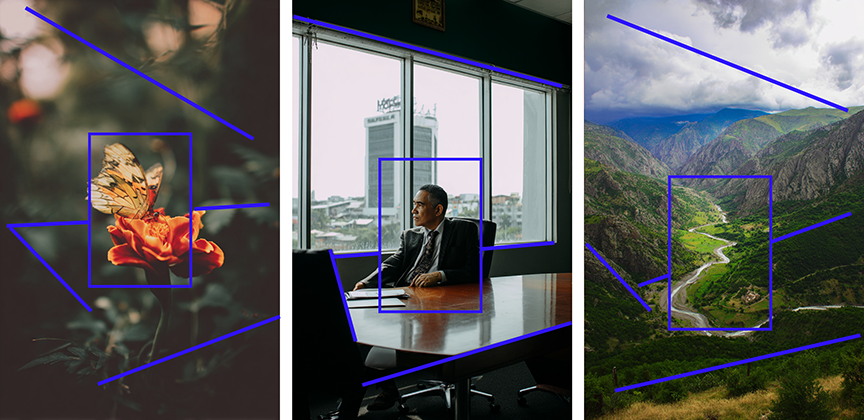
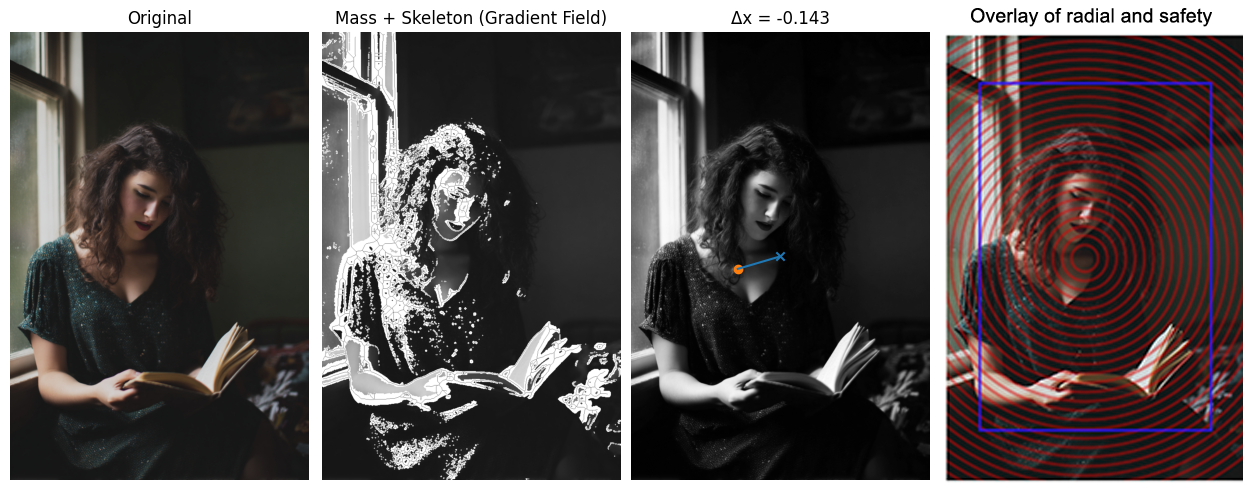
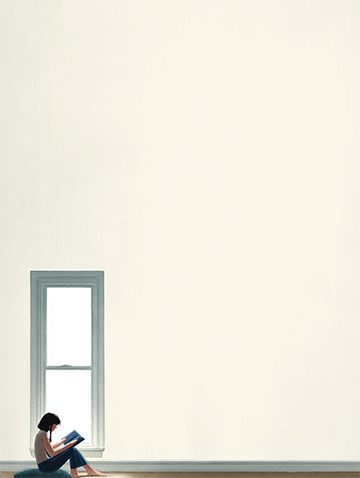
This shift from subject to mass is the only vocabulary move this document asks for. Everything else follows. When a kernel measurement says Delta x = −0.143 for a 'left-weighted' composition, it is not contradicting your eye. It is measuring something your eye was not tracking: not the subject, but the mass, the scaffold of the composition. While the artist might take a picture of a woman reading, they place it through mass and not the figure because it provides the structure, depth, and spatial stabilization (or destabilization) of any given subject to environment placement. Mass placement is almost always the underlying scaffolding of an image. The image is never just a woman reading, it is the window, the wall, the light, the shapes and movement of the scene.

Returning to this image: the gradient-weighted centroid of that scene is actually closer to center than the figure's position suggests, because the book in her hands, the window frame, the light source, and the background gradients all pull mass rightward to counterbalance the figure. That is compositional sophistication, practiced here. And the kernel finds it in every image.
Part 2: Why Composition Sets Before Content
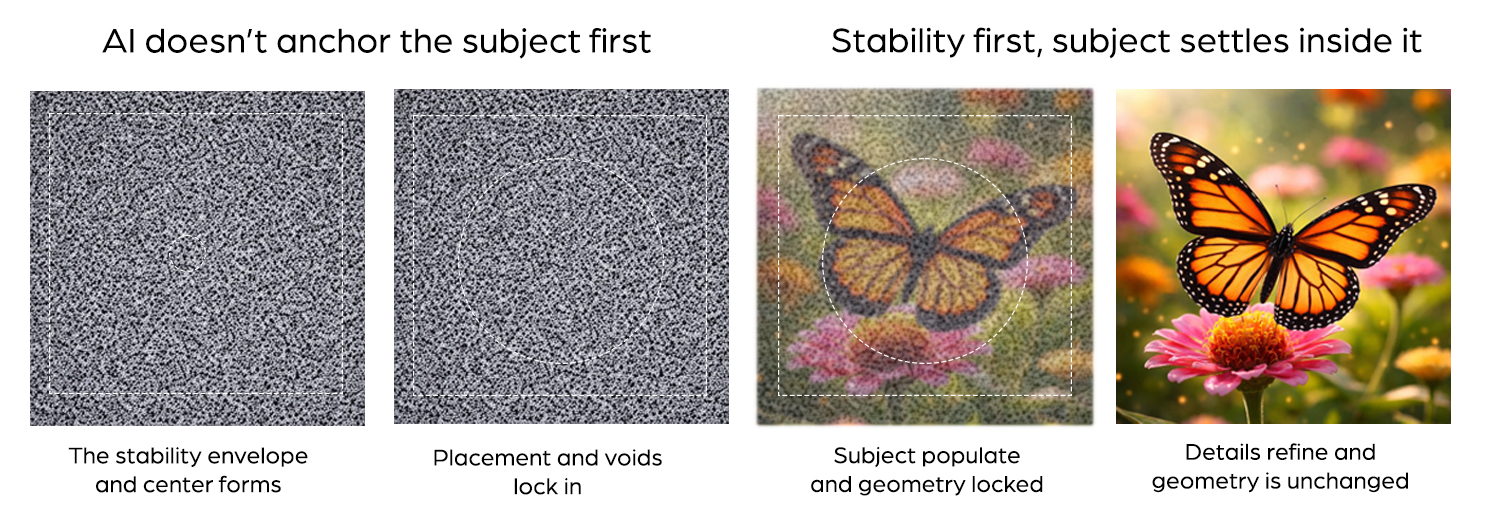
The most important thing to understand about diffusion-model generation is the sequence. Users see the final image. The compositional constraint was sealed much earlier.
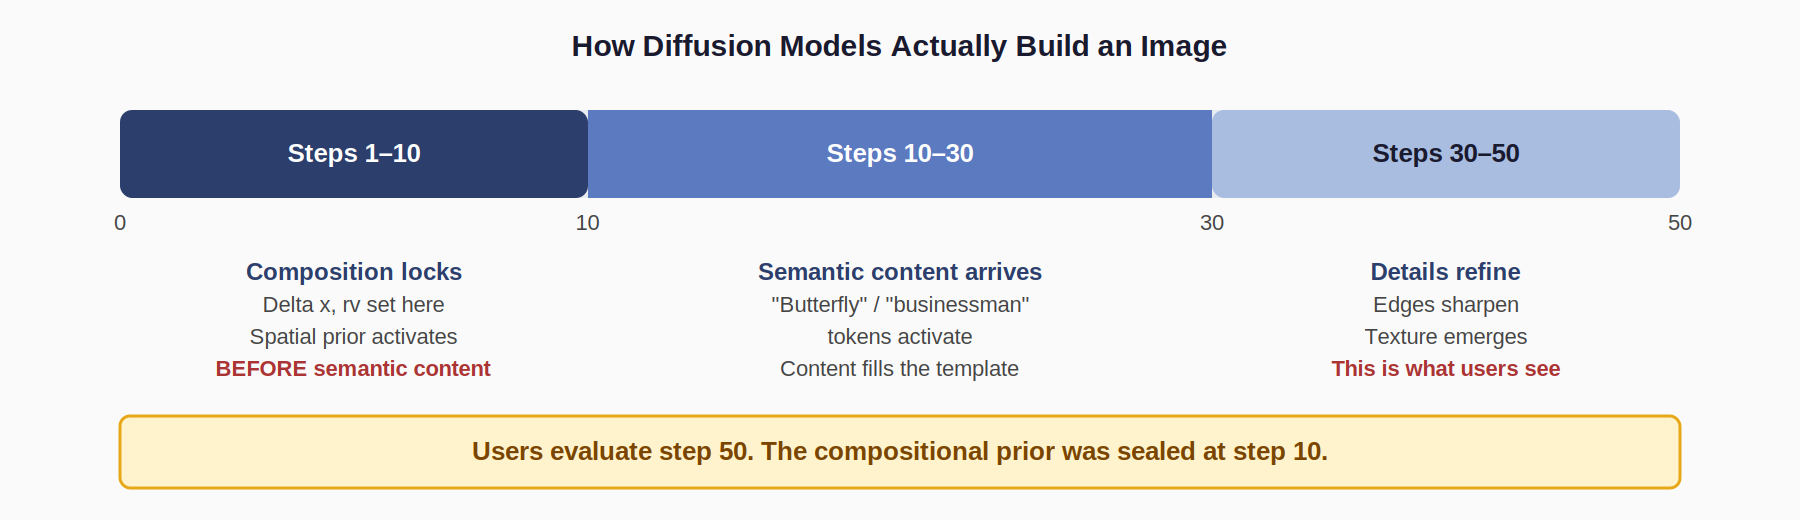
Steps 1–10: The spatial prior activates. Pure noise collapses toward a rough layout. Transformer attention establishes where 'important content' belongs. This creates a radial attention gradient: center tokens have 360-degree context; edge tokens have 180-degree context. The gradient falloff from center to periphery is the first physics of the image. Delta x and rv lock in here, before any semantic content exists.
Steps 10–30: Semantic content populates the template. Text-prompt tokens activate learned associations. Butterfly, businessman, cathedral tokens fire and place content into the pre-existing attention field. They do not choose where to go. The template was chosen. Prompts influence content. They rarely override structure.
Steps 30–50: Details refine. Edges sharpen, colors settle, textures resolve. The image begins to 'look like' its subject. This is what users evaluate. It is the last thing to arrive and the only thing most metrics measure.
The architecture reinforces this prior at every level. Center tokens have maximum contextual access. Training data skews toward centered, balanced subjects. RLHF reward models prefer centered, readable compositions because evaluators rate them as 'good.' The architecture, training data, and fine-tuning all push toward the same attractor basin. This is not a bug. It is a learned equilibrium.
The model generates subjects that fit its compositional physics, not subjects that best match the semantic prompt. When prompted 'grand cathedral interior,' radial architecture generates because radial structures match the compositional template, not because cathedrals are inherently radial.
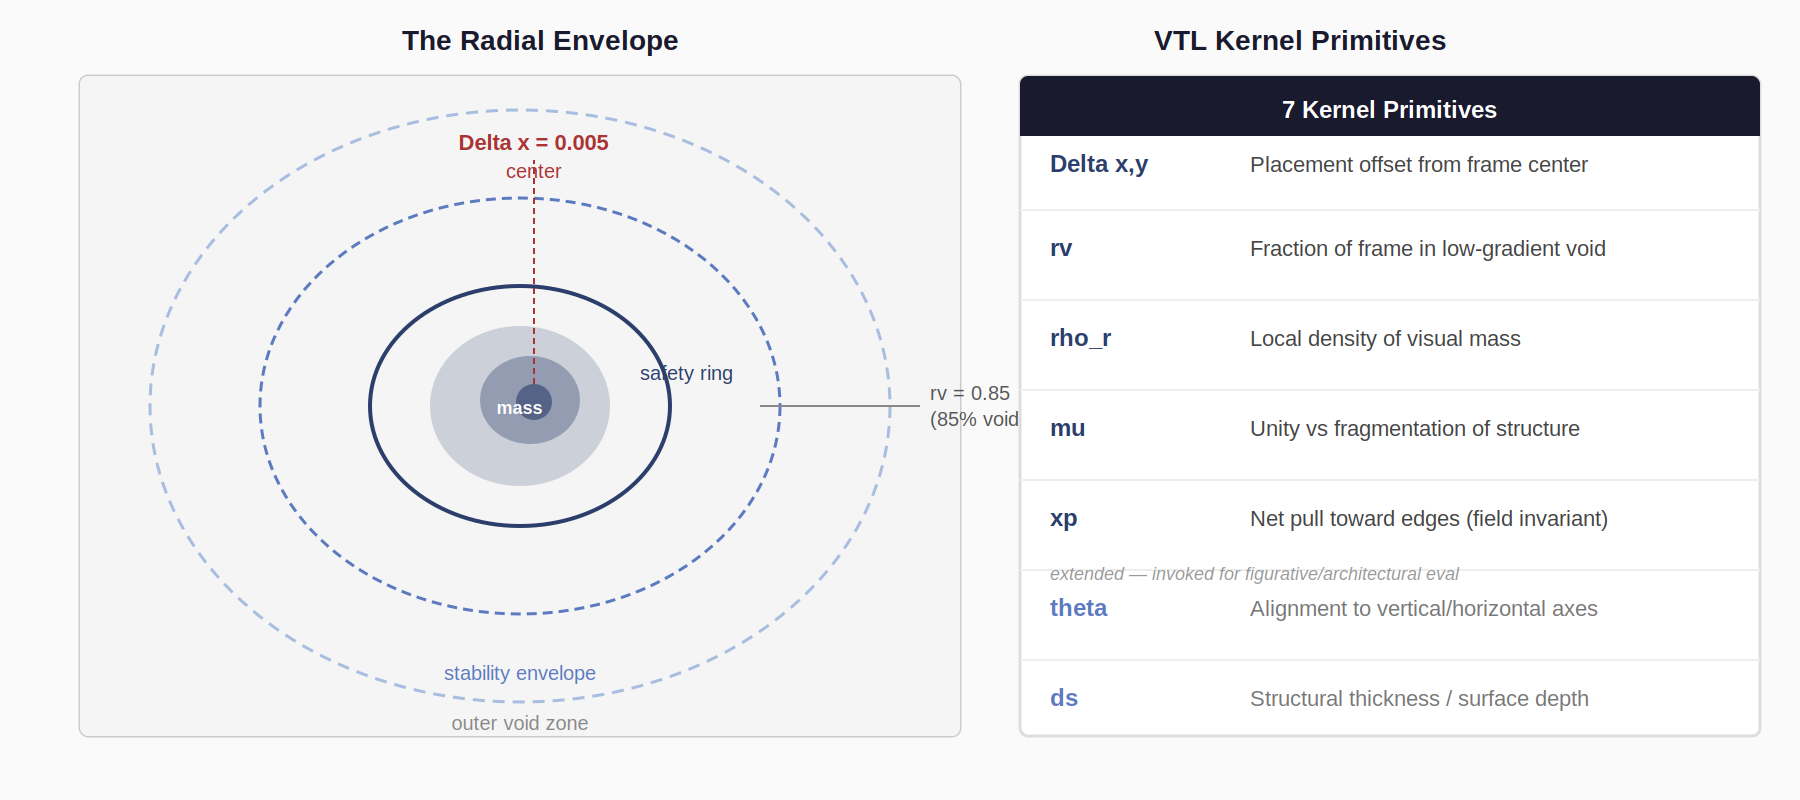
Part 3: The Kernel
Seven gradient-field primitives measure the spatial forces governing any image. They are model-agnostic, contrast-invariant, deterministic, and computationally fast: O(n) over image segments. Same image, same result, every time. No learned components.
| Metric | What It Measures | MJ Mean | MJ Std | Finding |
|---|---|---|---|---|
| Delta x,y | Horizontal/vertical placement offset | 0.0053 | 0.0444 | Only 34% of space used |
| rv | Void ratio: low-gradient fraction | 0.8505 | 0.0341 | 80–96% void on every image |
| ρr | Packing density of mass region | 40.92 | 12.36 | Over-detailed at center |
| μ | Cohesion vs. fragmentation | 0.268 | 0.245 | Low mean; fragmentation dominates |
| xp | Peripheral pull (field invariant) | 0.394 | 0.097 | Edge tension via fragmentation, not placement |
| θ | Orientation stability | 0.046 | 0.054 | Minimal directional coherence |
| ds | Structural thickness | 0.0167 | 0.0031 | Simulated depth, not volumetric form |
Two findings from this table deserve particular attention. First: xp (peripheral pull) = 0.394 through fragmentation (low μ = 0.268), not through lateral displacement (Delta x = 0.005). The model creates the appearance of edge tension by scattering detail across the frame or strong gradients rather than by actually placing the subject off-center. This produces what artists describe as 'muddy edges': compositional energy at the boundary that does not resolve into deliberate placement. Existing metrics cannot detect this distinction.

Second: ds = 0.0167 indicates thin, filamentary structures throughout. The model is rendering simulated depth rather than volumetric form. This is quantified evidence of something artists observe intuitively: AI-generated figures lack mass in the dimensional sense. They are surface renditions. The gradient is present; the weight is not.
Part 4: What 400 Images Show
Horizontal Placement (Delta x)
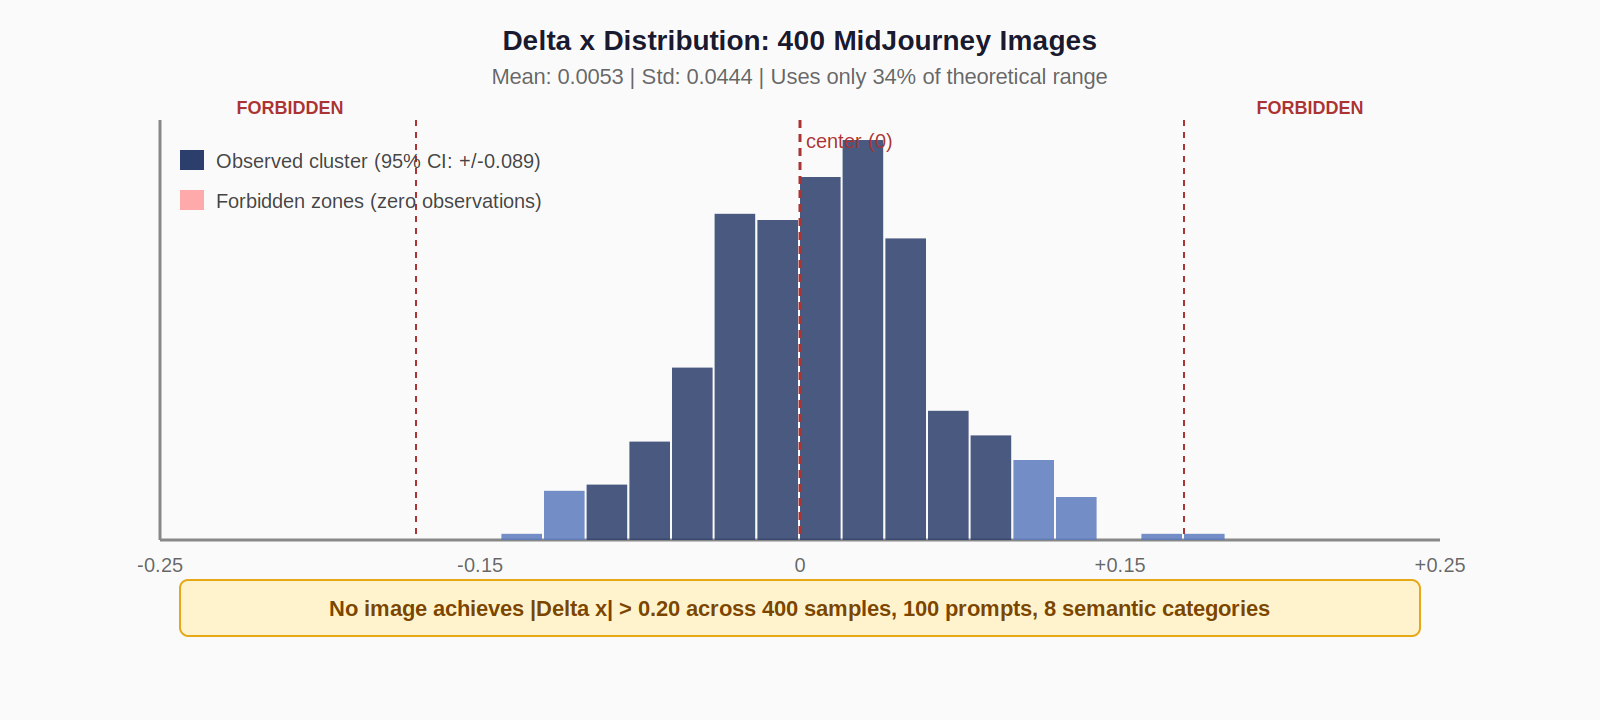
Theoretical range: −0.5 (extreme left) to +0.5 (extreme right). Observed range: −0.146 to +0.191. 95% of images fall within ±0.089 of center.
In the MidJourney monoculture set, the most extreme left image is the woman reading by a window, Delta x = −0.144, 15% off-center. Human artists routinely place figures at 40% displacement for the rule of thirds. The most extreme right image is a fractal pattern at Delta x = +0.191. Still well within what any painter or photographer would call 'centered.'
When told explicitly to place a figure 'in the extreme lower-left corner, vast empty white wall,' MidJourney generates Delta x = −0.1186. The prompt is honored semantically. A small figure exists. White wall surrounds it. Gradients pull the composition up and toward the center. The spatial prior remains. The prior is stronger than the prompt.
Void Ratio (rv)
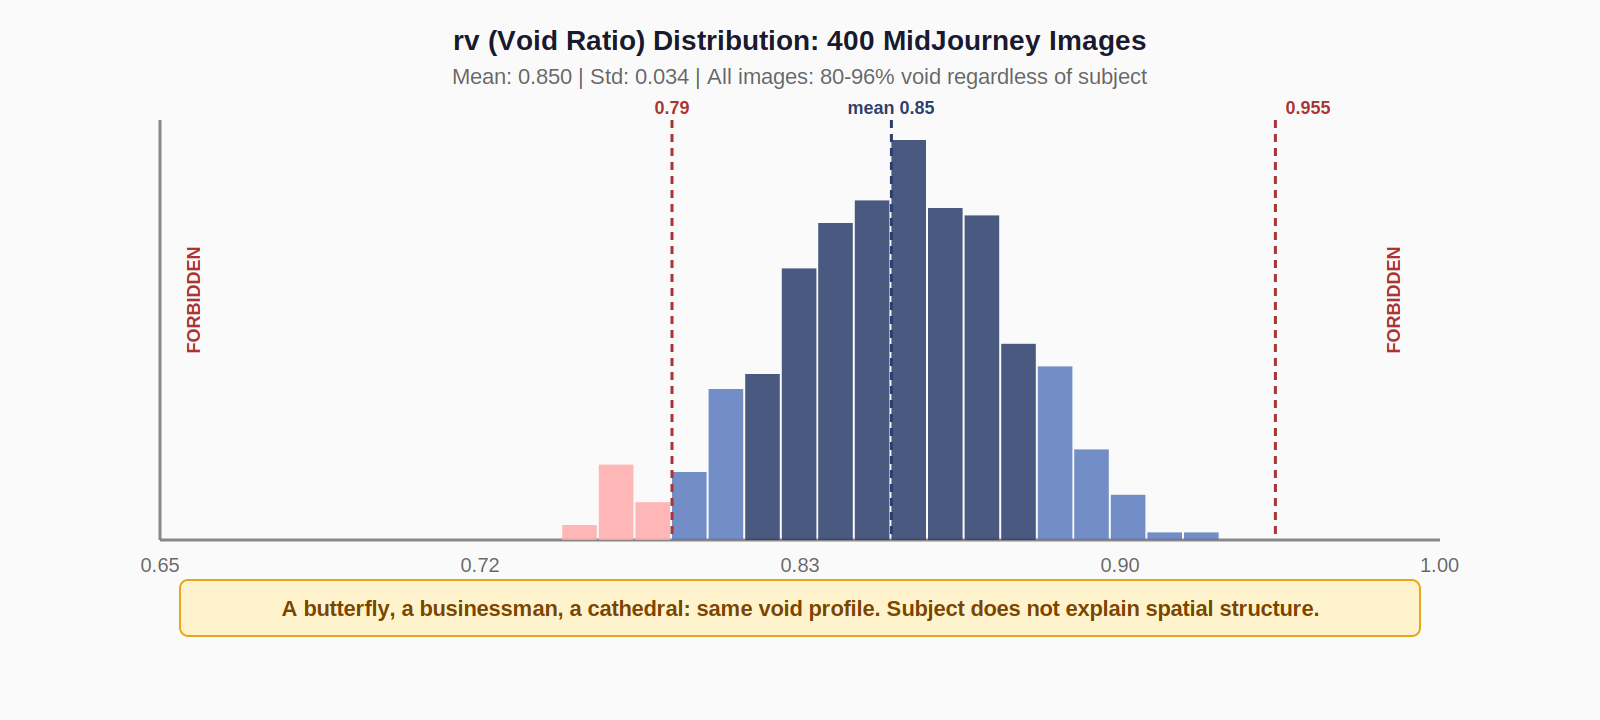
Theoretical range: 0 (all edges, fully packed) to 1.0 (completely empty). Observed range: 0.795 to 0.955. All 400 images cluster between 80% and 96% void.
Most void-heavy image: spring garden, rv = 0.954. 95% empty space, yet centered (Delta x = −0.053). Most packed image: octopus, rv = 0.795. Still 80% void, still centered (Delta x = +0.050). Even the outliers respect the template.
Different textures. Different colors. Different subjects. Same spatial structure. The model has learned to generate infinite semantic variations of one compositional template.
Part 5: Forbidden Zones
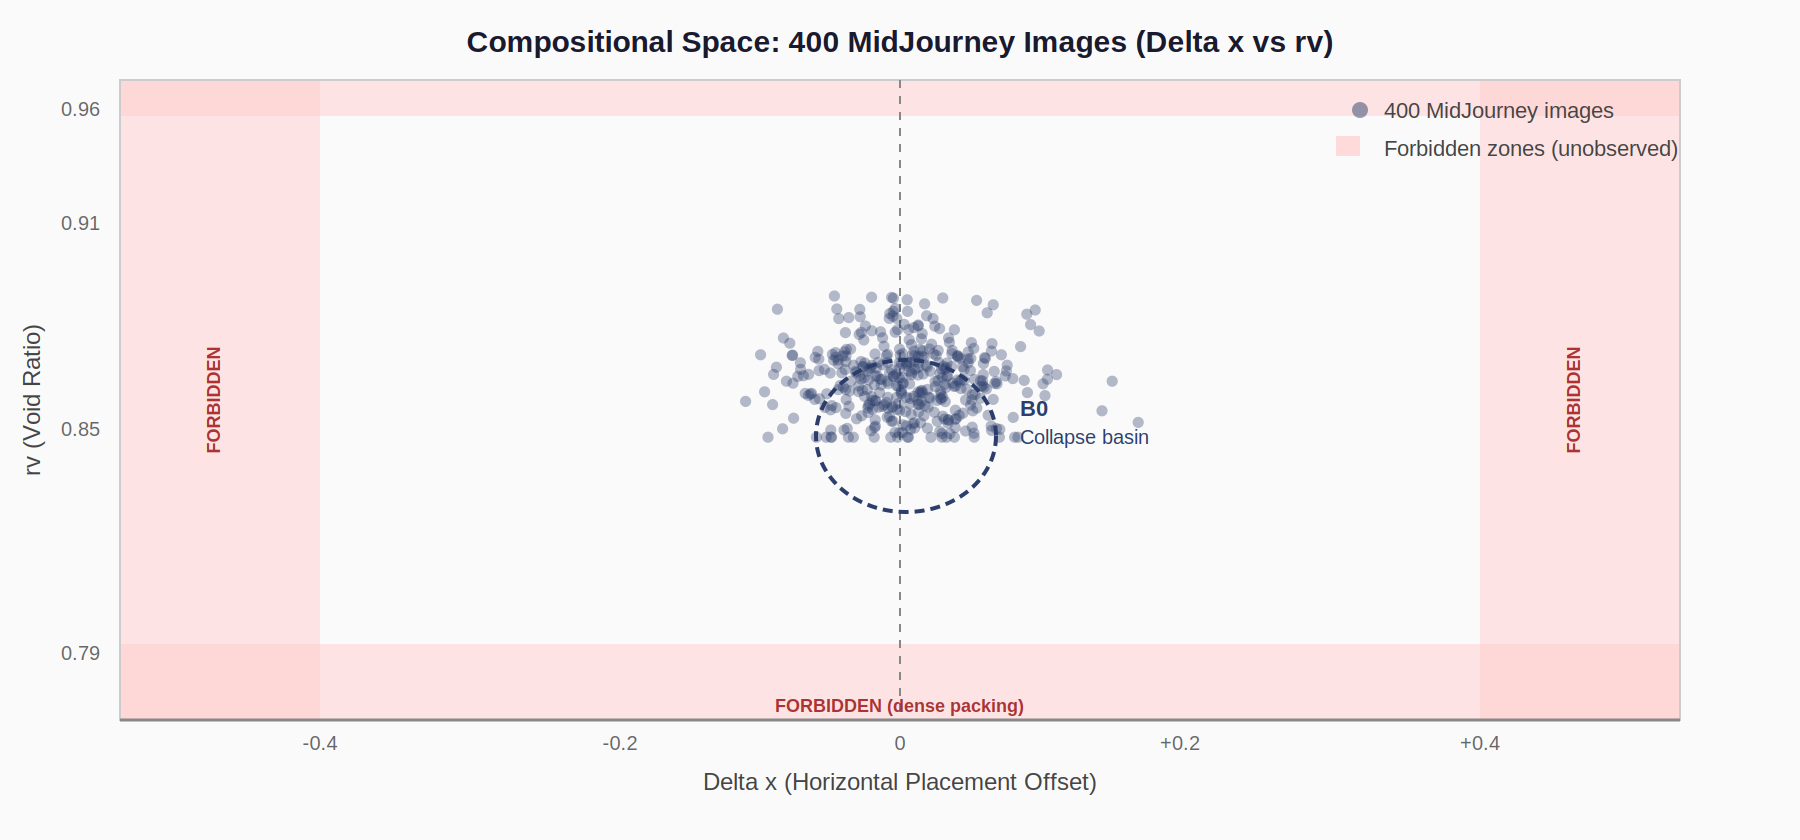
When all 400 images are plotted in Delta x–rv space, the revealing feature is not the cluster. It is the emptiness around it. Entire compositional territories are absent, not by chance, but by architectural constraint.
| Forbidden Zone | Empirical Boundary | Artistic Practice It Blocks | What It Requires |
|---|---|---|---|
| Strong asymmetry | Max |Delta x| = 0.191 | Rule of thirds, editorial photography | Delta x ≥ 0.33 |
| Dense packing | Min rv = 0.795 | Poster design, graphic layouts | rv < 0.60 |
| Intentional void | Max rv = 0.955 (low μ) | Minimalism, deliberate emptiness | High rv + high μ together |
| B3 zone (void + displacement) | Zero images: |Delta x| > 0.2 AND rv > 0.85 | Hokusai-type edge-weighted figures | Both extremes simultaneously |
These are not rare strategies. Rule of thirds (Delta x ≥ 0.33) is the first compositional technique taught in photography and painting. Poster-density design (rv < 0.60) is standard graphic design practice. The model's forbidden zones map directly onto the art school curriculum.
Canonical works occupy coordinates MidJourney cannot reach under standard prompting, but this is not saying it can't be done. Through adversarial prompting, compositional balances can be shifted.
However, they tend to be tradeoffs being mostly the singular focus of the prompt. Unlike, say, Caravaggio's The Calling of Saint Matthew which uses extreme edge lighting and radical asymmetry. Degas composes figures in competing directional vectors. Hokusai's The Great Wave places mass at the periphery with radical displacement. Vermeer constructs through rectangular framing devices that generate distributed gradient regions across multiple spatial planes. This is not a quality argument. It is a compositional range argument. AI, at present state, focuses on one rule to get it to snap outside the operating window boundary.
Part 6: Two Organizational Strategies
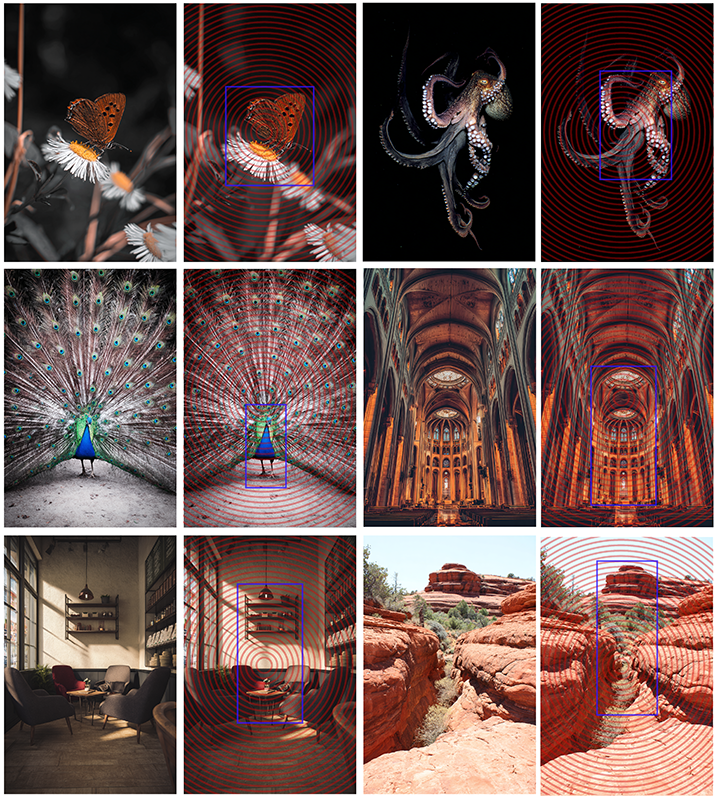
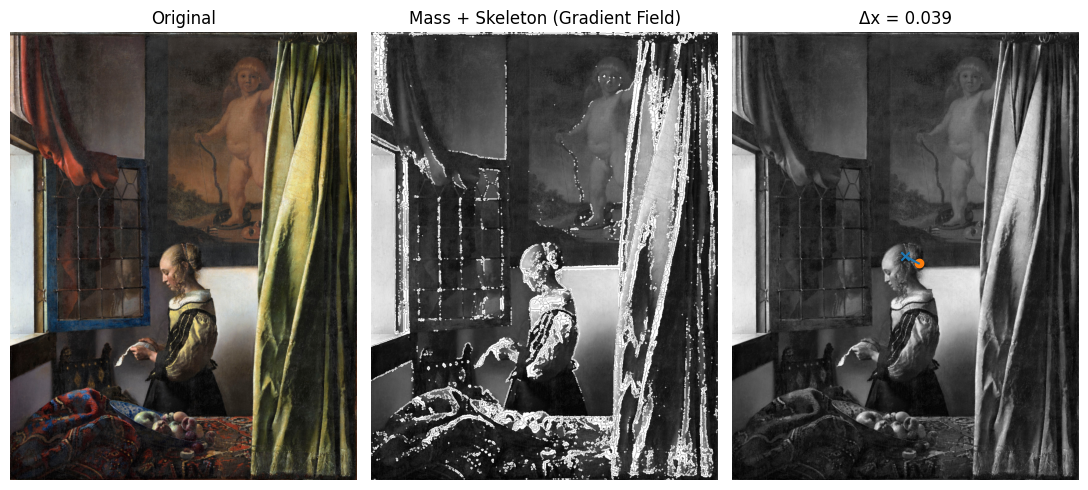
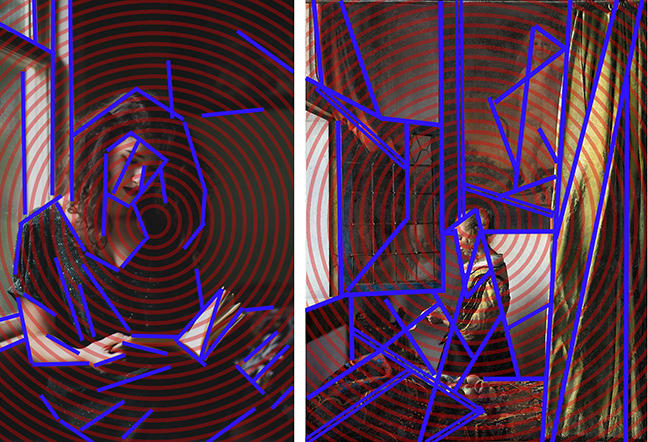
Below are side-by-side comparisons. MidJourney woman-reading-by-window with radial mass overlay (Delta x = −0.143 despite figure's left placement). And Vermeer's Girl Reading a Letter by an Open Window with gradient overlay showing distributed planar mass (Delta x = 0.039). Vermeer, one might quickly point out, is very centered.
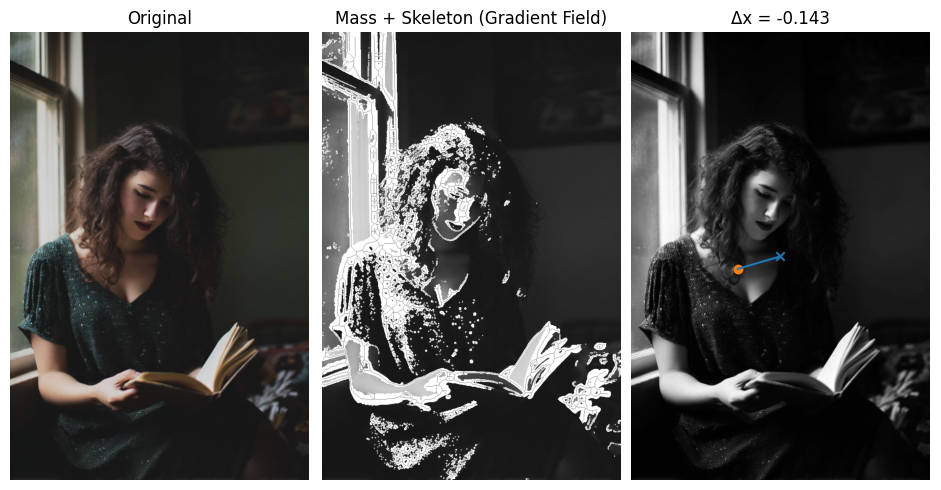
Vermeer composition distributes mass across multiple planar zones through rectangular framing devices. MidJourney, on the other side, organizes radially from center outward regardless of subject position, like many of its images.
Vermeer (Delta x = 0.039): Composition organized through rectangular framing devices. Window, curtain, letter, and painted map each generate gradient mass in distinct spatial planes. The mass is distributed across multiple zones at different depths, creating planar transitions. The eye moves on a path constructed from interlocking shapes.
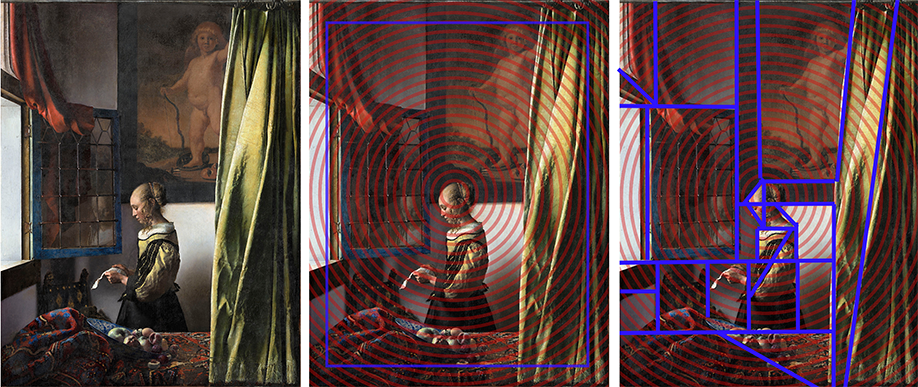
MidJourney (Delta x = −0.143): Despite the figure's left placement, gradient mass organizes radially from center outward. The window frame, the subject's hair, the book, and the light source all curve inward toward the compositional center of gravity. What the viewer reads as a left-weighted image is, at the gradient level, a center-weighted composition with a left-displaced subject.
AI, in a number of corpus runs, radially distributes naturally from the center.
This is not a quality comparison. It is evidence of organizational strategy: diffusion models employ a structurally distinct compositional system that persists regardless of semantic content, and that system differs fundamentally from how trained artists construct space.
Part 7: Why Existing Metrics Cannot See This
CLIP measures semantic similarity. It does not ask where the butterfly is, only whether a butterfly is present. A centered butterfly and a Hokusai-positioned butterfly score identically.
FID measures distance between generated and real feature distributions. The training data has the same compositional bias as the generated outputs. The benchmark is built on the bias it is supposed to measure.
Aesthetic predictors learn human preferences. Human preferences have been shaped by decades of photography, social media, and AI output. Centered, balanced, readable compositions score well because that is what the rater population has been trained on. The feedback loop is closed.
T2I-CompBench and GenEval measure relational correctness. Spatial constraints are met while compositional collapse remains invisible.
The evaluation ecosystem measures what goes into the image. Nobody was measuring where it went, or whether it went to the same place every time. Geometric behavior is measured only by the kernel.
Conclusion: The Template
Diffusion models do not generate images. They generate a compositional template in the first ten denoising steps, populate it with semantic content in the following twenty, and refine the surface details in the last twenty. Users see step fifty and interpret it as diversity.
The template parameters for MidJourney in vertical 2:3 format: Delta x = 0.005 ± 0.044 (centered), rv = 0.850 ± 0.034 (85% void), mass organized within a radial envelope. This template loads for butterflies, businessmen, cathedrals, and fractals. Different content. Same structure.
The contribution of this framework is measurement infrastructure: quantitative bounds on compositional range, vocabulary for describing what artists have always perceived and researchers have lacked tools to verify, a diagnostic that makes the invisible visible and, therefore, addressable.
Citation: Russell Parrish. Mass, Not Subject: Reading AI-Generated Images Through Gradient Fields. A.rtist I.nfluencer, 2025. ORCID: 0009-0008-9781-7995.