FK Reliability Failure on IMS-Class Compact Arrays:
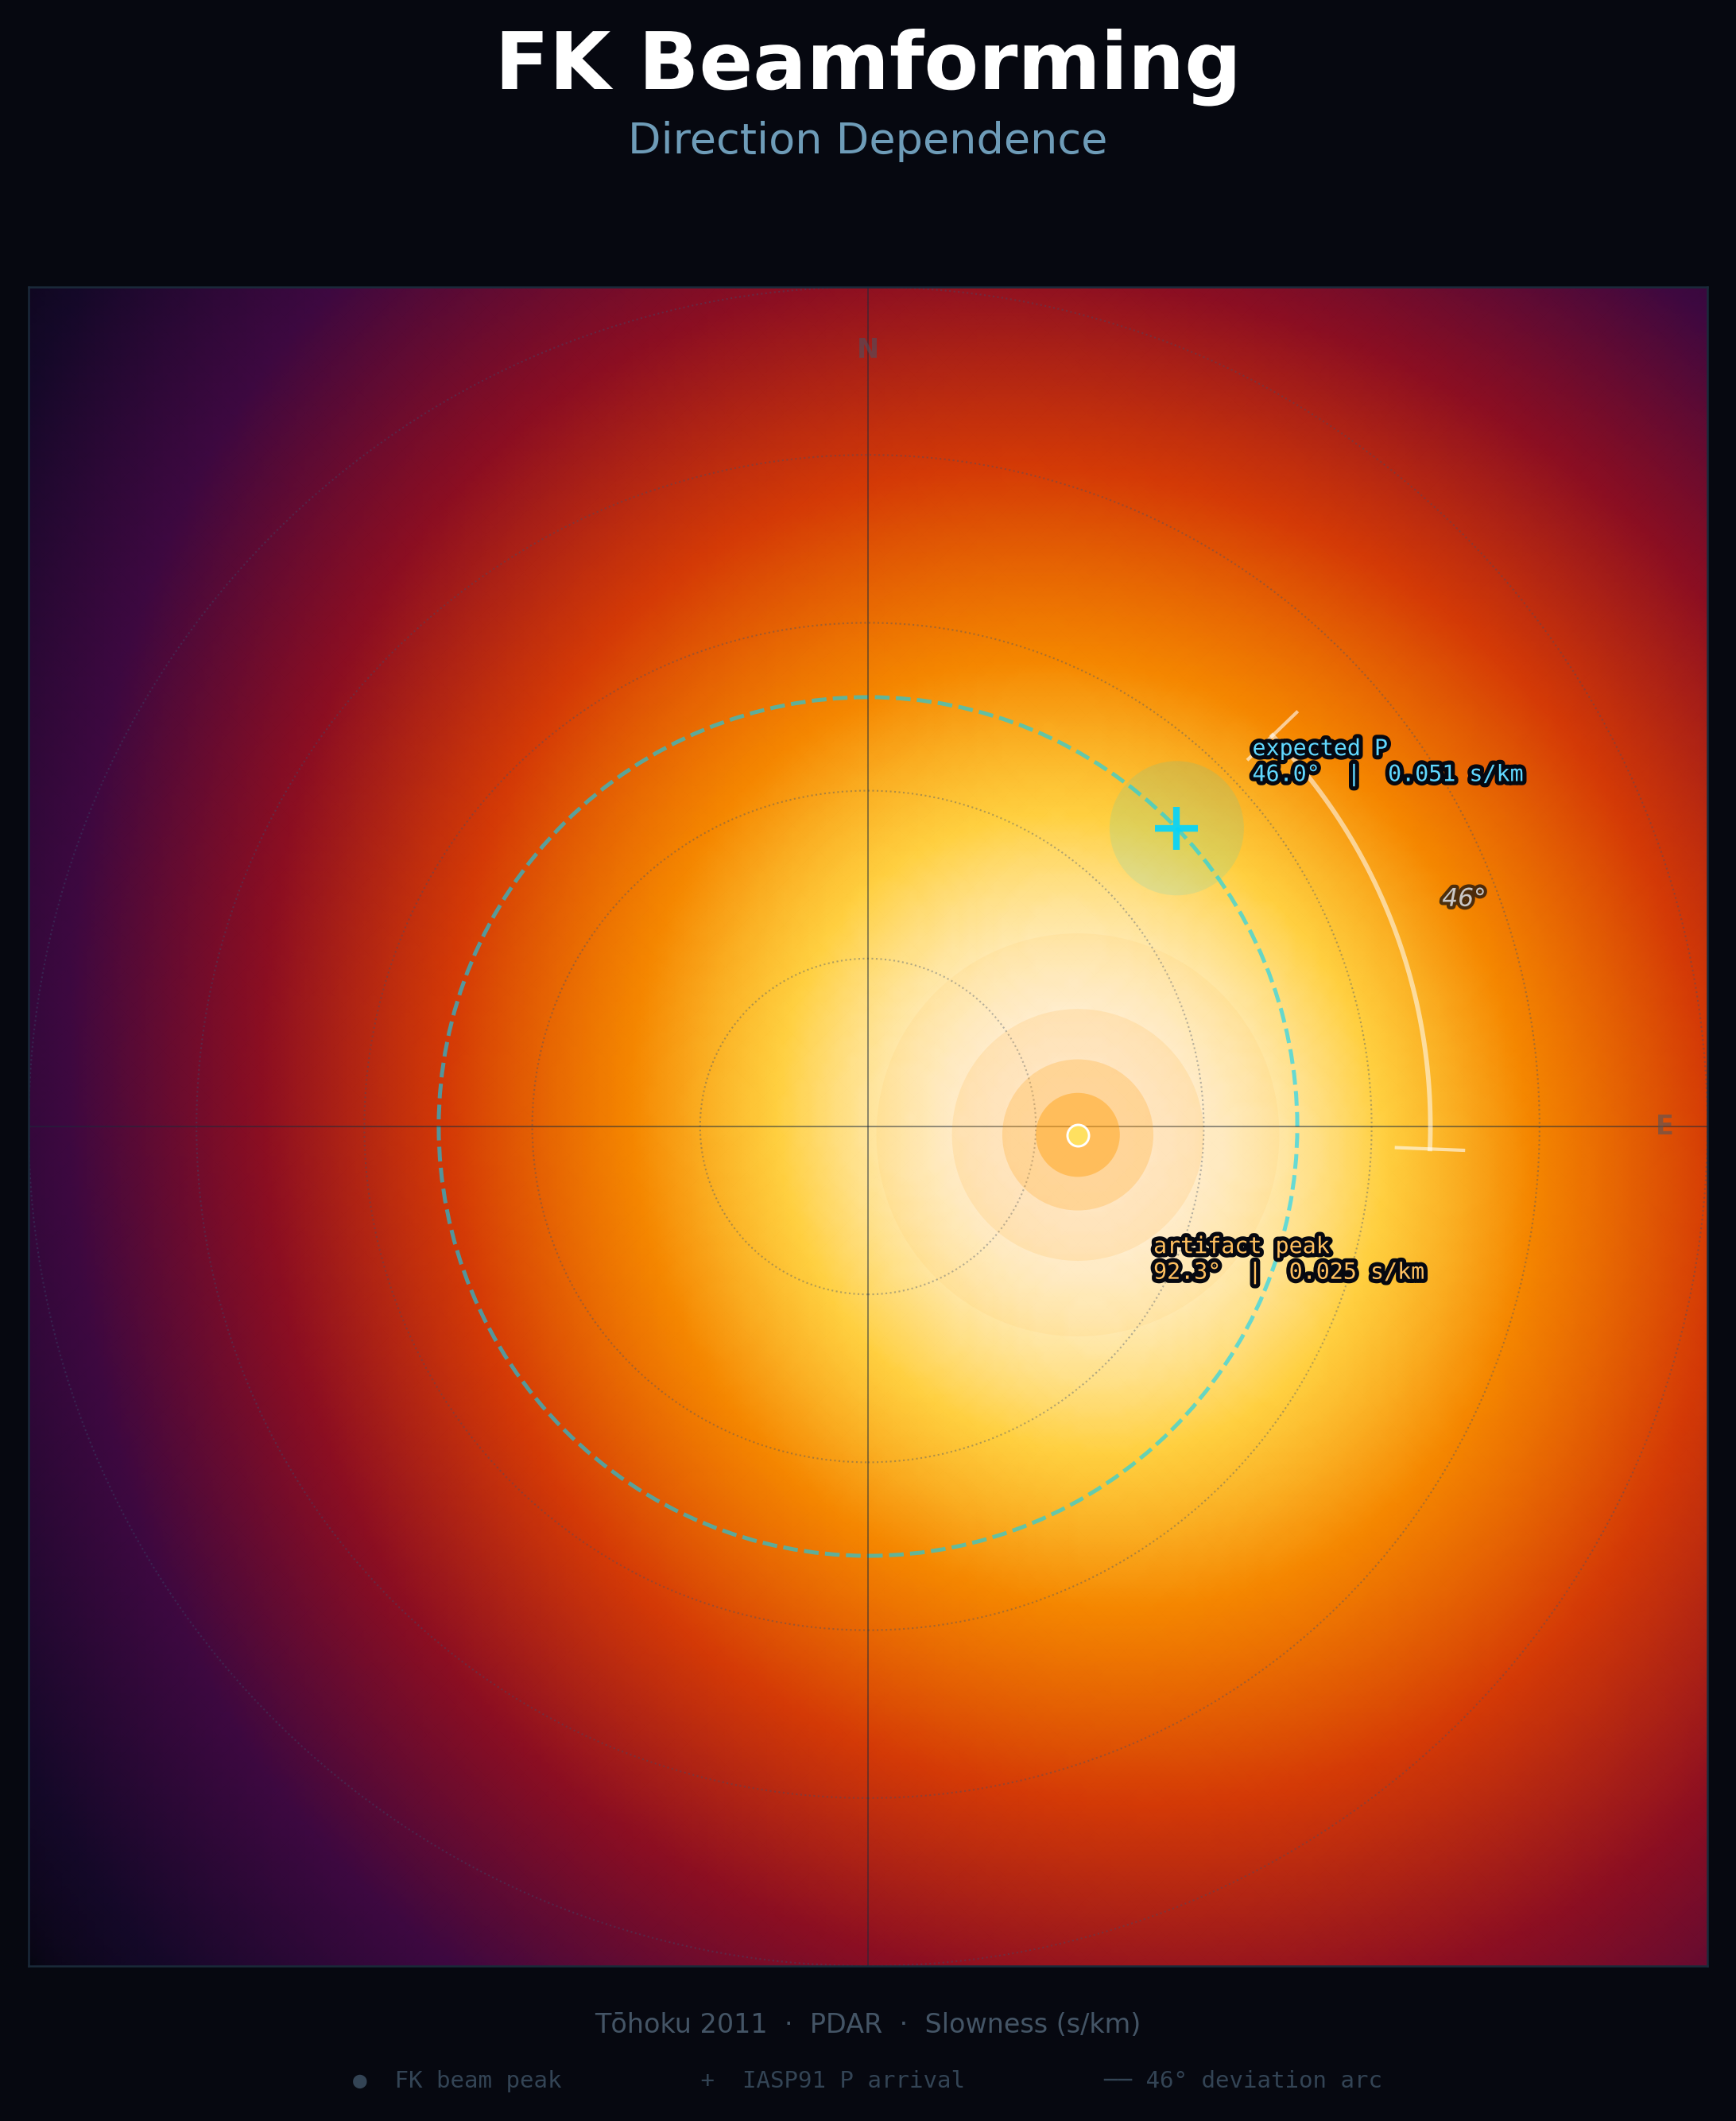
FK slowness grid, Tōhoku 2011 / PDAR. Artifact peak (●) deviates 46° from expected P arrival (+). See §6.3.3 and Cover Figure.
Abstract
FK beamforming on three IMS-class compact arrays (PDAR, Idaho; TXAR, Texas; NVAR, Nevada) produces large back-azimuth errors, ranging from 46° to 175° across 12 test cases spanning five events (Mw 6.9–9.0) and two source directions, that are not predicted by theoretical Array Response Function (ARF) computation. Power surface analysis of the failure cases confirms the direct P arrival is present at 68–71% of the FK peak power, FK selects a competing energy concentration at reduced apparent slowness despite the direct P being clearly present. The failure is a peak-selection error on a nearly flat power surface (peak is only 1.4–1.5× the direct-P power level), not an absence of direct P energy. This eliminates two natural alternative explanations: direct P is not missing; and FK is not simply finding a stronger real seismic phase. A synthetic FK test establishes that real wavefield structure is required to produce the failure: a perfect plane wave recovers the correct direction at SNR as low as 1×, ruling out geometric noise sensitivity. A two-component synthetic FK model, direct P plus pPcP at variable amplitude ratio, falsifies pPcP as the competing phase on two independent grounds: every NW-Pacific failure involves an azimuth rotation of 46°–131° that no mixture of phases sharing the same great-circle path can produce, and PDAR artifact slownesses (0.022–0.025 s/km) lie 41% below the hard lower bound imposed by pPcP slowness, unreachable at any physical amplitude ratio. The FK artifact directions, projected as great-circle rays from each array, reveal a structured geographic pattern: Japan/Tōhoku artifact rays from PDAR and TXAR point toward the Pacific coast at the Cascadia subduction zone and Southern California, while Fukushima and Aleutian artifact rays from TXAR converge to the same point (22°N, 91°W, Gulf of Mexico) despite differing source azimuths by 27°, consistent with a fixed directional noise source and geographically aligned with known North American oceanic microseismic fields. Sliding-window decomposition classifies the US-array failures into three distinct mechanisms: persistent pre-existing directional ambient noise (Type I), sparse-station fragile coherence coupled to the P wavefield (Type II), and robust multi-station coherent off-axis signals consistent with fixed directional noise sources at Cascadia and the Gulf of Mexico (Type III). Beam-steered waveform decomposition of the Type III cases recovers a signal that is absent before P onset (pre-P/P-window power ratio 10−4–10−5), spectrally concentrated in the microseismic band (0.3–0.8 Hz peak, 58–72% of broadband power), and diffuse in envelope, consistent with P-wave energy from oceanic noise-source regions, inconsistent with a discrete seismic phase. A single operational diagnostic, the ratio of observed FK slowness to theoretically expected slowness — discriminates the dominant failure population without ground truth: all nine NW-Pacific failures yield ratios of 0.45–0.73×, all Chile results yield 1.08–1.44×, with a gap of 0.35. A threshold of slowness ratio < 0.75 flags all NW-Pacific failures with zero false positives. Three events at WRA (Warramunga, Australia) confirm FK failure at a fourth array via a distinct failure mode: a persistent dominant background signal producing an event-invariant north-northeast artifact (ratio consistently > 1.0), distinct from the off-axis competing signal at US arrays. The failure landscape is mechanistically heterogeneous; the same operational symptom, slowness underestimation, is produced by physically distinct processes requiring array-specific empirical characterization.
1. Introduction
Frequency-wavenumber (FK) beamforming is a foundational technique in seismic array processing, used operationally for event detection, back-azimuth estimation, and phase identification at IMS (International Monitoring System) arrays worldwide. The technique's theoretical reliability is typically characterized by the array's response function (ARF), which quantifies how well a given array geometry can discriminate between slowness vectors. For arrays with clean theoretical ARFs, no grating lobes, no directional nulls, FK is generally assumed to be reliable across the azimuthal range.
This assumption is incorrect under real operating conditions for compact arrays whose aperture is sub-wavelength relative to the dominant signal frequency. We present evidence that FK beamforming on three IMS-class compact arrays fails systematically for a subset of events, producing errors of 46°–175°, while the theoretical ARF for the same arrays shows maximum directional bias of 1.5°. The failure is not predictable from theory. It requires empirical characterization.
The difficulty of FK beamforming on small-aperture arrays has been recognized since the foundational frequency–wavenumber studies of Lacoss et al. (1969) and Capon (1969), both arising from nuclear monitoring array research at LASA. The Array Response Function (ARF) became the standard tool for characterizing directional sensitivity, and compact IMS arrays were evaluated on this basis (Ingate and Husebye, 1991). Operationally, persistent systematic discrepancies between measured and theoretical slowness and back-azimuth values led to the development of empirical slowness–azimuth station corrections (SASC), which demonstrably improved single-array location performance (Bondár et al., 1999). These corrections demonstrate that systematic back-azimuth discrepancies have long been recognized and that their operational impact can be reduced, but they do not distinguish among the physical mechanisms that produce them. The present study focuses on that distinction. We identify multiple failure families that produce similar FK symptoms and show that ARF-based performance expectations do not predict a specific failure regime producing errors of 46°–175° on three compact US arrays for events arriving from the NW Pacific sector.
The central contribution of this paper is a practical quality diagnostic: the ratio of FK-measured slowness to theoretically expected slowness. This ratio cleanly separates the NW-Pacific underestimation population from the Chile population across all 12 US-array cases, 3 arrays, and both source directions tested, with a gap of 0.35 between the two groups. It requires no knowledge of the true back-azimuth, only a distance estimate and a standard Earth model. A multi-event result at WRA (Warramunga, Australia) extends the characterization to a fourth array on a second continent and identifies a second failure mechanism, persistent spatial noise, distinct from secondary-phase contamination.
1.1 Contributions
- Empirical characterization of FK back-azimuth failure across 15 cases, 7 events, 4 arrays on 2 continents
- Full theoretical ARF computation confirming the failure is not geometrically predicted
- Synthetic FK test (perfect plane wave + realistic noise) establishing that real wavefield structure is required, geometry plus noise cannot reproduce the failure
- Slowness-ratio diagnostic with non-overlapping population separation, no ground truth required; operational recommendation: ratio < 0.75 as a one-parameter FK quality flag
- Sliding-window decomposition audit classifying FK failures into three mechanistically distinct types, persistent pre-existing ambient dominance (Type I), sparse-array coherence instability (Type II), robust multi-station coherent off-axis signals (Type III), with different implications for array design, noise characterization, and monitoring practice; the ratio flag detects the operational symptom across all three types; decomposition separates the underlying physical mechanisms
- Two-component synthetic FK model falsifying pPcP as the competing phase on two independent grounds: azimuth rotation impossible in same-path phase mixtures; PDAR artifact slownesses 41% below model hard lower bound
- Geographic analysis of FK artifact directions revealing structured convergence toward North American oceanic microseismic noise source regions (Pacific/Cascadia and Gulf of Mexico), with TXAR Fukushima and Aleutian rays converging to the same point despite 27° difference in source azimuth
- Beam-steered waveform decomposition of Type III PDAR cases characterizing the competing signal as P-onset coupled (pre-P/P-window ratio 10−4–10−5), spectrally concentrated in the microseismic band (0.3–0.8 Hz peak, 58–72% of broadband power), and diffuse in envelope, ruling out both a pre-existing ambient source and a discrete seismic phase; supporting the oceanic noise-source geographic hypothesis with waveform evidence
- Three-event WRA (Australia) result establishing a third failure mode, persistent spatial noise, distinct from pPcP secondary-phase contamination; event-invariant N–NNE artifact confirmed across Japan 2021, Kuril 2006, W. Aleutian 2017
- Statistical validation: exact permutation test (p = 0.0045, 1/220), Mann-Whitney U (p = 0.0080, r = 1.000), bootstrap CIs confirming non-overlapping populations
- Parameter sensitivity: result robust across P-window lengths 20–60 s and P-onset timing shifts of ±10 s
2. Arrays and Data
2.1 Array Geometry
Three IMS-class compact arrays are included in this study: PDAR (Pinedale Seismic Research Observatory, Idaho), TXAR (Texas Seismological Array, Texas), and NVAR (Nevada Test Site Array, Nevada). All three operate as short-period vertical-component arrays (SHZ channel) within the IM network. Array apertures range from 3.63 km (PDAR) to 7.30 km (NVAR core), placing all three in the sub-wavelength regime at the 0.8–2.0 Hz band used for P-wave beamforming (Table 1, Figure 2).
| Array | Location | Stations | Aperture | aperture/λ at 1 Hz | Network | Channel |
|---|---|---|---|---|---|---|
| PDAR | 42.77°N, 109.56°W (Idaho) | 13 | 3.63 km | 0.45 | IM | SHZ (20 Hz) |
| TXAR | 29.34°N, 103.68°W (Texas) | 8 | 4.45 km | 0.56 | IM | SHZ (40 Hz) |
| NVAR | 38.43°N, 118.30°W (Nevada) | 11 | 7.30 km | 0.91 | IM | SHZ (40 Hz) |
| WRA† | 19.93°S, 134.37°E (N. Territory, AU) | 11 (5 avail.) | 21.9 km (9.3 km eff.) | 2.7 (1.16 eff.) | AU | BHZ (40 Hz) |
Table 1. Array parameters. Aperture/λ computed at 1 Hz using apparent teleseismic P velocity (~8 km/s crustal reference; apparent velocity ~19–20 km/s at these distances places all arrays well into the sub-wavelength regime across 0.8–2.0 Hz). PDAR, TXAR, and NVAR are sub-wavelength across the analysis band. NVAR core array (NV01–NV10, 7.30 km aperture) is shown; station NV11 lies 13.2 km east of the core cluster and is included in analysis with all 11 stations. † WRA (Warramunga, AU network) is supra-wavelength at full aperture. Three events were analyzed: Japan 2021 (5/11 stations, effective aperture 9.27 km, aperture/λ ≈ 1.16), Kuril Islands 2006 (10/11 stations, 21.93 km full aperture, aperture/λ ≈ 2.7), and W. Aleutian 2017 (9/11 stations, 19.1 km aperture). Chile 2010 is not analyzable from WRA (P shadow zone at 118.6°).
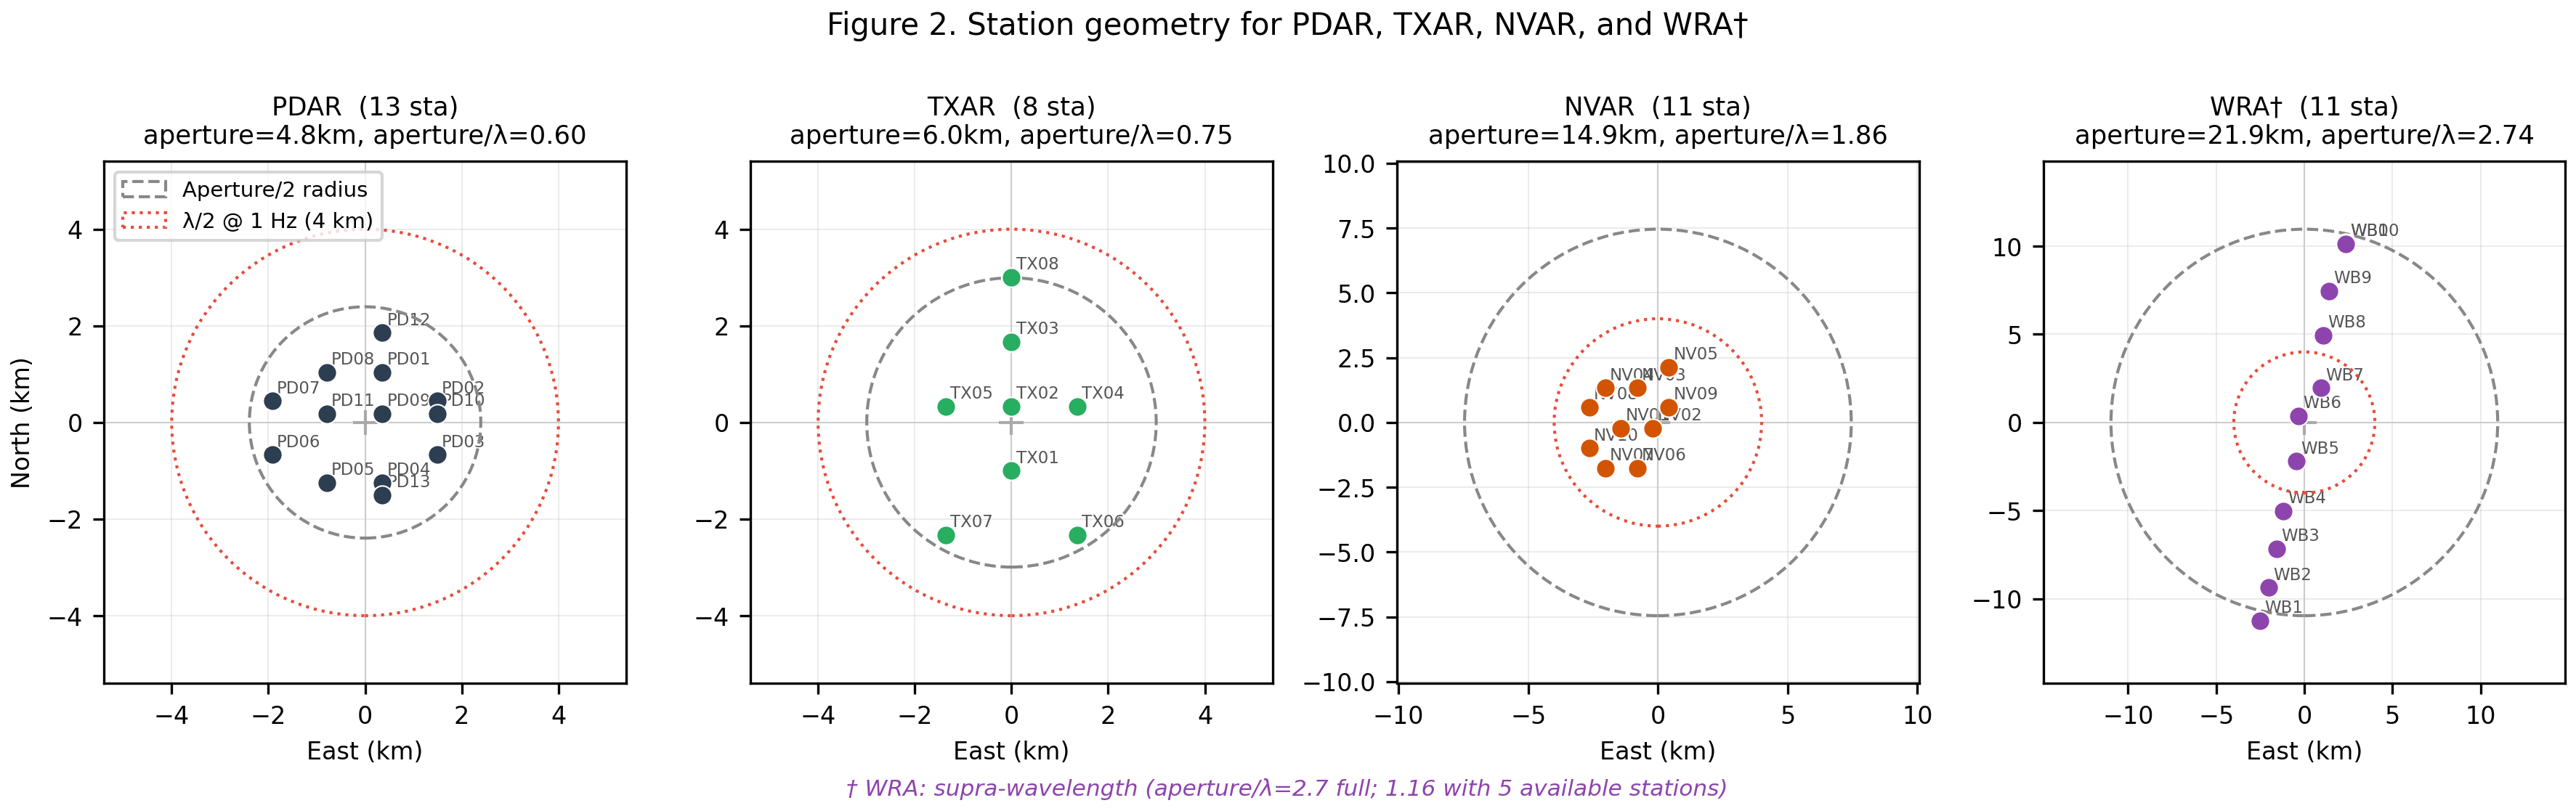
Figure 2. Station geometry for PDAR (13 stations), TXAR (8 stations), and NVAR (11 stations). Dashed circle = aperture/2 radius. Dotted red circle = λ/2 at 1 Hz using crustal Vp reference (4 km); apparent teleseismic P wavelength at 1 Hz is ~20 km, placing all arrays well below λ/4. All three arrays are sub-wavelength; NVAR has the largest core aperture (7.30 km) but remains aperture/λ < 1 across most of the analysis band.
2.2 Events
Five teleseismic events are included, spanning magnitude classes Mw 6.9–9.0 and two distinct source directions from the arrays (Table 2, Figure 1). The NW-Pacific group (four events) arrives from back-azimuths of 46°–80° as measured at the array centers. The South American event (Chile 2010, Mw 8.8) arrives from approximately 326°–334°. No major seismic zone lies in the azimuthal gap between these two populations at teleseismic distance from the study arrays, making them naturally isolated test populations.
| Event | Date | Mw | Depth | Region | baz PDAR | baz TXAR | baz NVAR |
|---|---|---|---|---|---|---|---|
| Tōhoku | 2011-03-11 | 9.0 | 29 km | Japan | 46.0° | 52.8° | — |
| Japan 2021 | 2021-02-13 | 7.1 | 55 km | Japan | 45.6° | 52.4° | 53.3° |
| Aleutian 2014 | 2014-06-23 | 7.9 | 109 km | Aleutians | 71.1° | 79.7° | — |
| Fukushima 2016 | 2016-11-21 | 6.9 | 11 km | Japan | 45.4° | 52.2° | — |
| Chile 2010 | 2010-02-27 | 8.8 | 35 km | Chile | 333.7° | 331.7° | 325.9° |
Table 2. Events included in the study. Back-azimuths are measured from event epicenter to array center (forward azimuth convention). Chile event highlighted, the only direction from which FK succeeds on PDAR and TXAR.
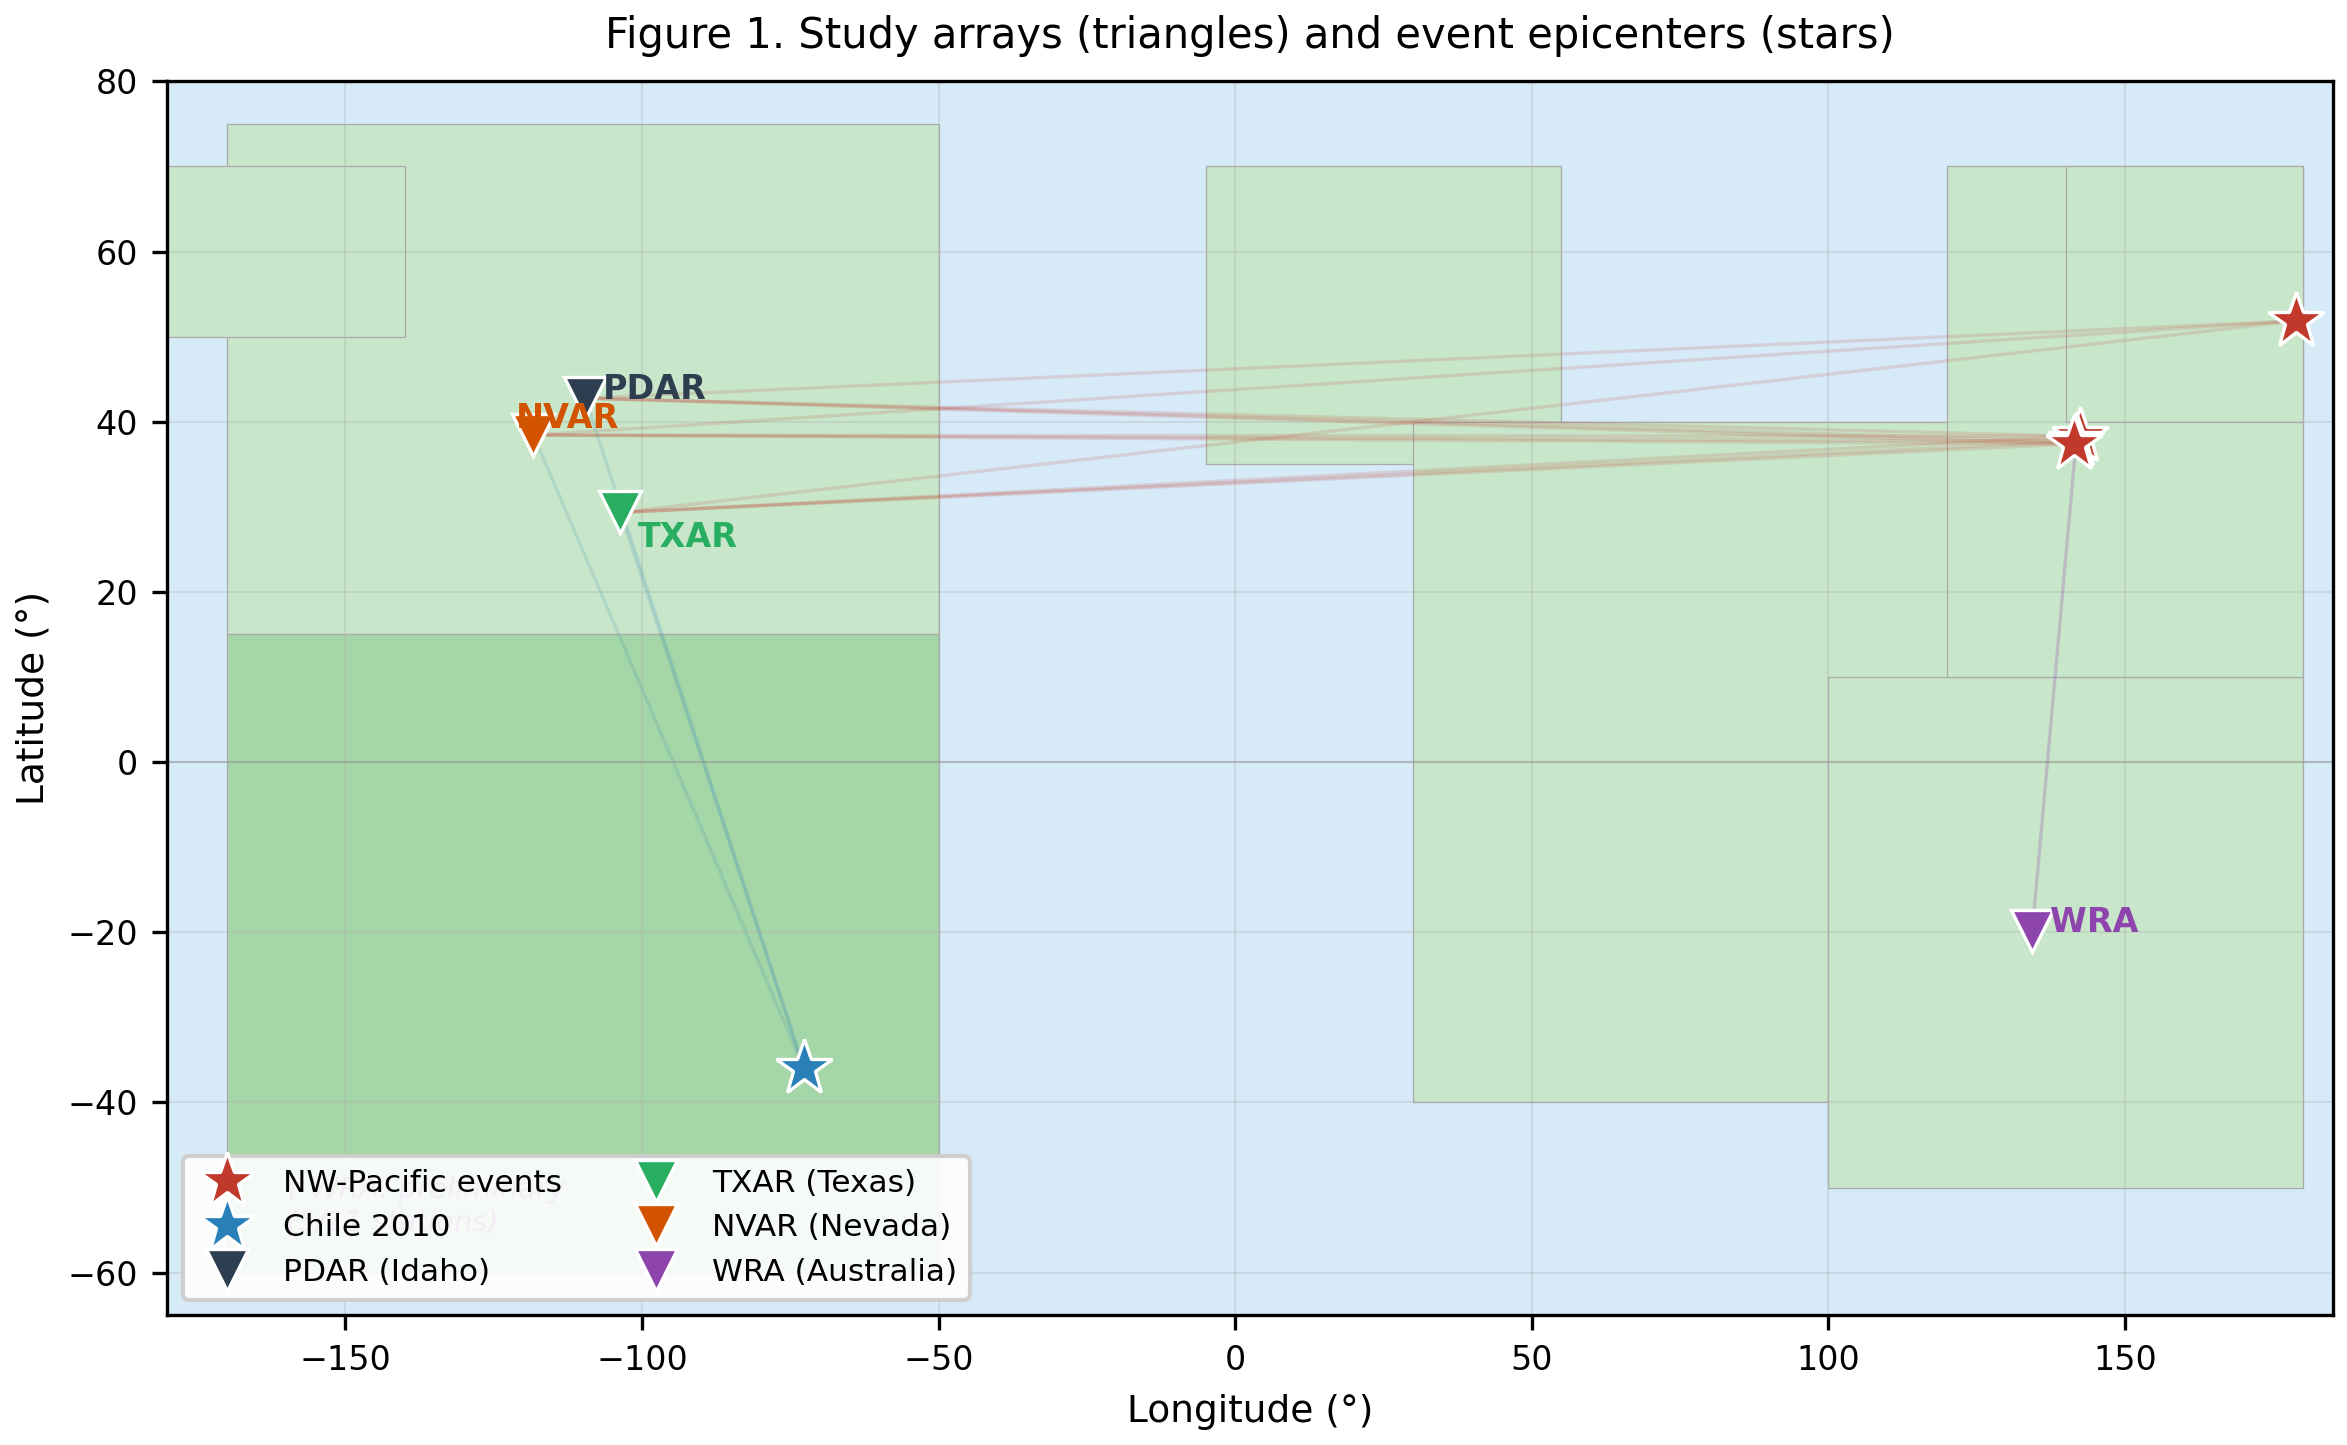
Figure 1. Geographic locations of arrays (triangles: PDAR, TXAR, NVAR) and event epicenters (stars). NW-Pacific events shown in orange-red; Chile 2010 in blue. Faint lines indicate event-to-array paths. Arrays are in the western United States; the two event populations arrive from nearly opposite azimuths.
2.3 Data and Processing
Waveforms were retrieved from IRIS/EarthScope using the FDSN webservice. For each event and array, a window extending from 60 s before the predicted P arrival (TauPy, iasp91 model) to 300 s after was downloaded. The P analysis window is the 30 s following the predicted P onset. A 4-pole Butterworth bandpass filter of 0.8–2.0 Hz is applied prior to FK analysis, consistent with standard IMS P-wave monitoring practice.
3. FK Analysis Results
3.1 Array Response Function
The theoretical ARF was computed for all three arrays across azimuths from 0° to 355° in 5° steps, using a broadband frequency grid (0.5–2.0 Hz, 20 samples). For each test azimuth, a plane wave was injected at the correct slowness for the given geometry and the FK peak was identified. Maximum directional bias across all 72 azimuths tested: 1.5° for both PDAR and TXAR; ≤1.5° for NVAR. On-axis ARF power exceeds 0.999 everywhere. No grating lobes, no directional null zones.
3.2 Complete Results Table
| Event | Mw | Array | baz_true | FK baz | FK err | Slowness | Expected | Ratio | Population |
|---|---|---|---|---|---|---|---|---|---|
| Tōhoku 2011 | 9.0 | PDAR | 46.0° | 92.3° | 46.3° | 0.0250 | 0.0511 | 0.49× | NW-Pacific |
| Tōhoku 2011 | 9.0 | TXAR | 52.8° | 119.2° | 66.5° | 0.0287 | 0.0424 | 0.68× | NW-Pacific |
| Japan 2021 | 7.1 | PDAR | 45.6° | 105.3° | 59.7° | 0.0228 | 0.0510 | 0.45× | NW-Pacific |
| Japan 2021 | 7.1 | TXAR | 52.4° | 117.4° | 65.0° | 0.0304 | 0.0510 | 0.60× | NW-Pacific |
| Japan 2021 | 7.1 | NVAR | 53.3° | 312.9° | 100.5° | 0.0382 | 0.0524 | 0.73× | NW-Pacific |
| Aleutian 2014 | 7.9 | PDAR | 71.1° | 300.5° | 130.7° | 0.0394 | 0.0696 | 0.57× | NW-Pacific |
| Aleutian 2014 | 7.9 | TXAR | 79.7° | 298.4° | 141.3° | 0.0421 | 0.0616 | 0.68× | NW-Pacific |
| Fukushima 2016 | 6.9 | PDAR | 45.4° | 278.4° | 127.0° | 0.0273 | 0.0505 | 0.54× | NW-Pacific |
| Fukushima 2016 | 6.9 | TXAR | 52.2° | 299.2° | 113.0° | 0.0287 | 0.0417 | 0.69× | NW-Pacific |
| Population gap, slowness ratio 0.73 → 1.08 (no overlap) | |||||||||
| Chile 2010 | 8.8 | PDAR | 333.7° | 338.2° | 4.5° | 0.0485 | 0.0449 | 1.08× | Chile |
| Chile 2010 | 8.8 | TXAR | 331.7° | 330.2° | 1.5° | 0.0784 | 0.0545 | 1.44× | Chile |
| Chile 2010 | 8.8 | NVAR | 325.9° | 140.4° | 174.6° | 0.0597 | 0.0447 | 1.33× | Chile† |
| WRA (Australia), persistent spatial noise failure mode | |||||||||
| Japan 2021 | 7.1 | WRA‡ | 188.3° | 333.1° | 144.9° | 0.0818 | 0.0630 | 1.30× | WRA‡ |
| Kuril Is. 2006 | 8.3 | WRA‡ | 199.2° | 8.5° | 169.4° | 0.0607 | 0.0562 | 1.08× | WRA‡ |
| W. Aleutian 2017 | 7.7 | WRA‡ | 212.9° | 41.8° | 171.1° | 0.0630 | 0.0486 | 1.30× | WRA‡ |
Table 3. Complete FK results for all 15 cases. Slowness in s/km. Ratio = observed/expected. Blue rows: Chile events with correct FK direction. Yellow row: Chile/NVAR, antipodal failure (§3.4). Purple rows: WRA results, fourth array, different failure mode (§6.7). † NVAR Chile failure mode. ‡ WRA: supra-wavelength array; Kuril 2006 used 10/11 stations (full aperture 21.93 km), Aleutian 2017 used 9/11 stations. All WRA events show ratio > 1.0 and FK artifact consistently pointing N–NNE (333°, 8.5°, 42°) regardless of source direction, characteristic of persistent spatial noise rather than secondary-phase contamination.
3.3 Population Statistics
| Population | N (cases) | N (arrays) | FK err mean | FK err range | Ratio mean | Ratio range |
|---|---|---|---|---|---|---|
| NW-Pacific (baz 46–80°) | 9 | PDAR, TXAR, NVAR | 94.0° | 46.3°–141.3° | 0.60× | 0.45–0.73× |
| Chile (baz ~326–334°), correct dir | 2 | PDAR, TXAR | 3.0° | 1.5°–4.5° | 1.26× | 1.08–1.44× |
| Chile, NVAR antipodal failure | 1 | NVAR | 174.6° | — | 1.33× | — |
Table 4. Population statistics. The two primary populations (NW-Pacific fail, Chile correct) are fully separated in slowness ratio with a gap of 0.35. The NVAR Chile antipodal failure occupies the Chile ratio range despite a large direction error, indicating a distinct failure mechanism.
3.4 Failure Mode Classification
The 15 cases span multiple failure mechanisms distinguished by their slowness ratio signatures, artifact geometry, timing, and station-removal behavior. At the broadest level, two failure signatures emerge from the slowness ratio alone; sliding-window decomposition (§6.3) subsequently reveals three physically distinct sub-types within the NW-Pacific slowness-underestimation population.
Failure mode 1: Systematic slowness underestimation (NW-Pacific events). All nine NW-Pacific cases produce FK slowness of 0.45–0.73× the expected value. The artifact direction varies across cases, Tōhoku and Japan 2021 produce artifacts at ~92–119° (east); Aleutian and Fukushima produce artifacts at ~278–300° (WNW); Japan 2021 at NVAR produces an artifact at ~313°. The artifact direction is not fixed. It is wave-direction- dependent and varies between arrays. The consistent signature is the slowness underestimation, not the artifact azimuth.
Failure mode 2: ±180° antipodal ambiguity (Chile/NVAR). Chile 2010 at NVAR produces FK pointing to 140.4°, within 6° of the antipode of the true direction (325.9°, antipode at 145.9°). The FK slowness is 1.33× expected (not underestimated). Power surface analysis confirms the beam constructively adds at the antipodal direction with 3.9× the power at the true direction. This is a phase-ambiguity failure distinct from the slowness underestimation mode: the FK is resolving a real feature at approximately the correct slowness magnitude but in the wrong hemisphere of slowness space.
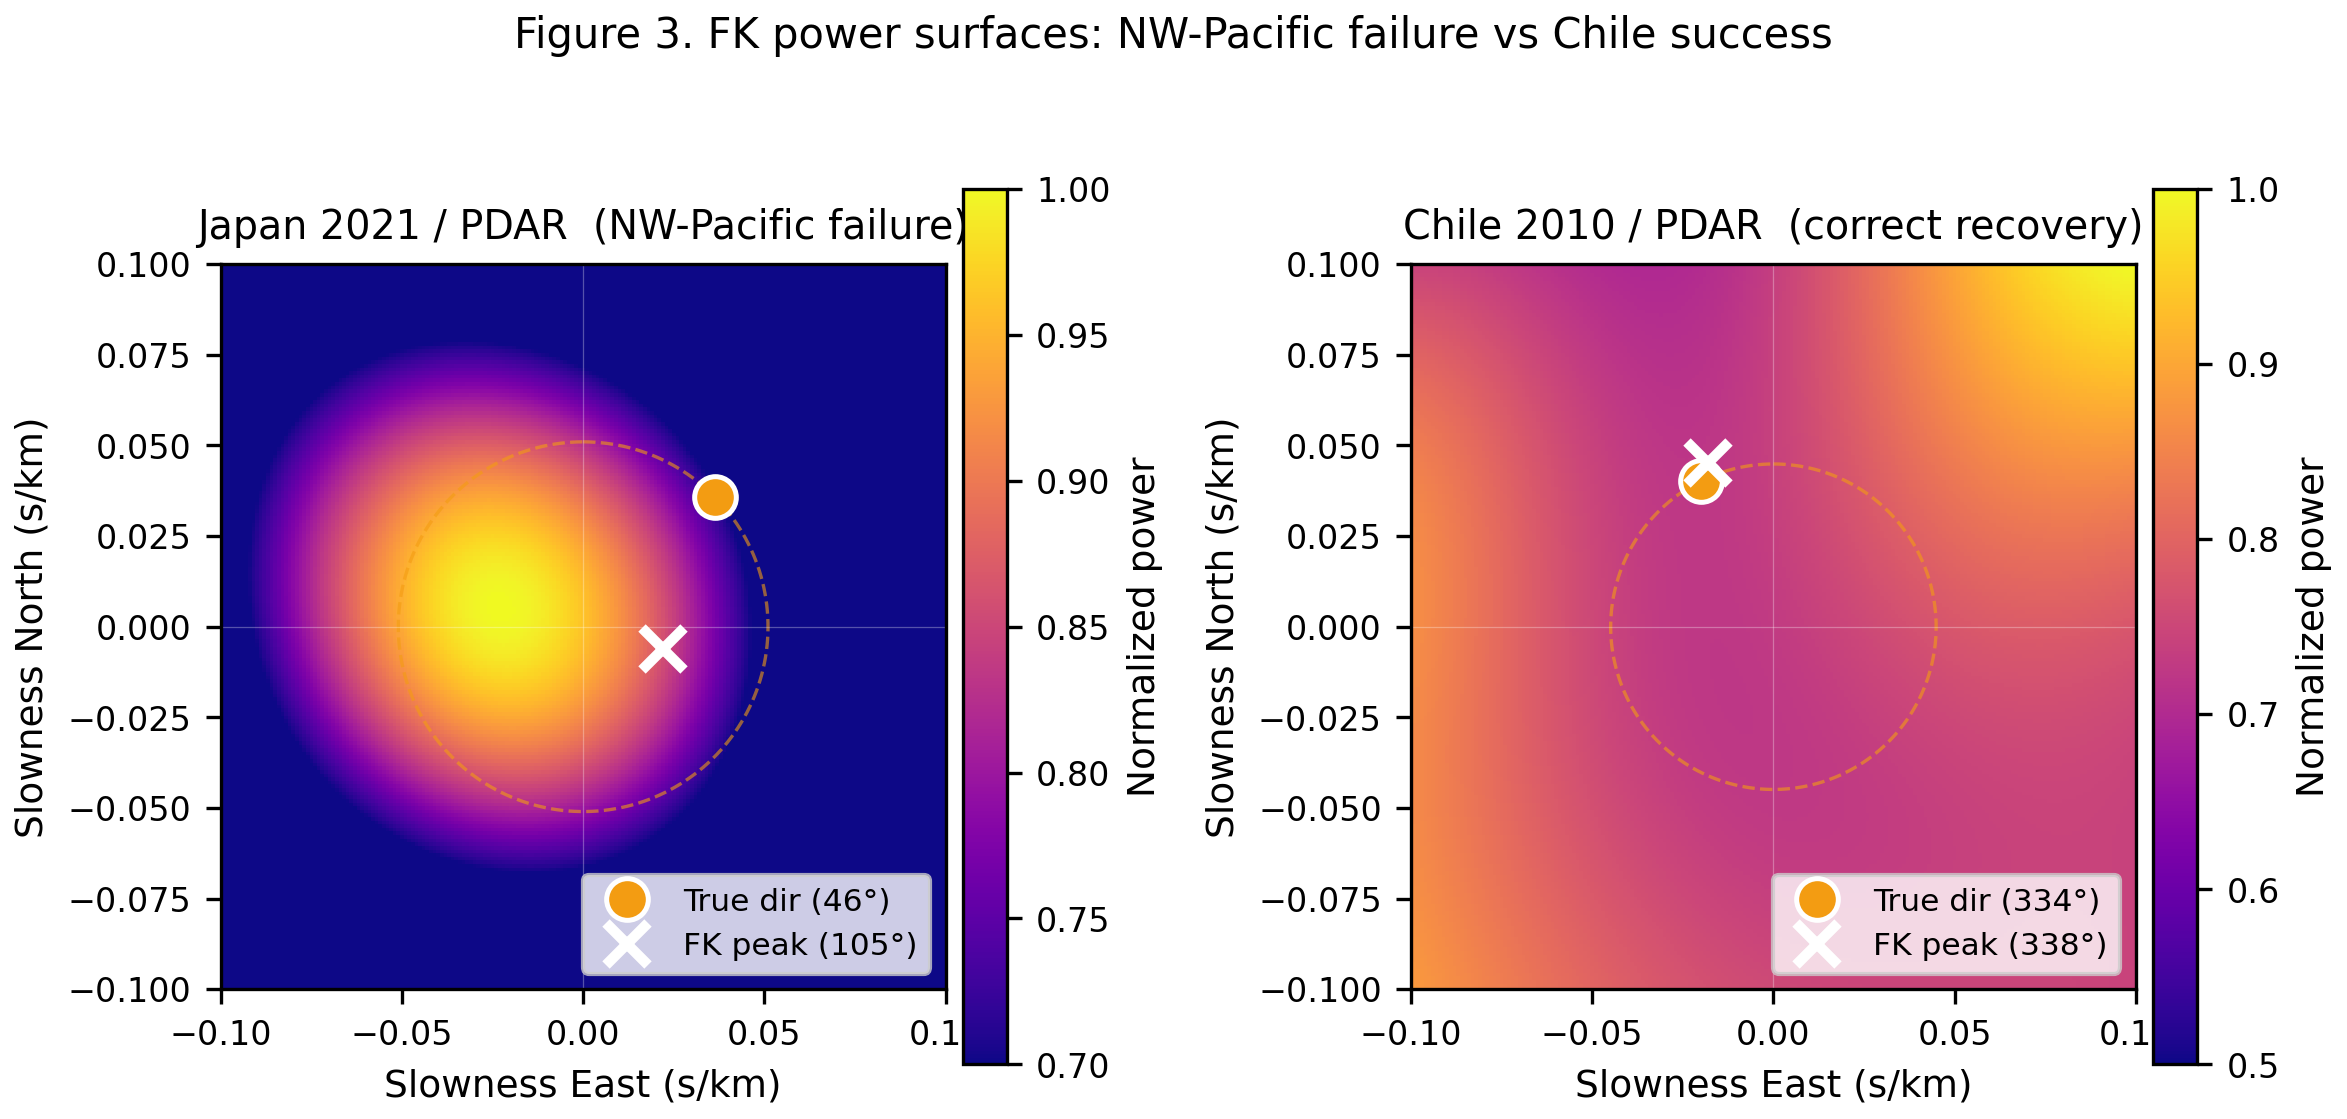
Figure 3. FK power surfaces for representative cases. Left: Japan 2021 / PDAR (NW-Pacific failure). White cross = FK peak (105.3°, ratio 0.45×); orange circle = true direction (45.6°) at expected slowness. The FK peak is at less than half the expected slowness and 60° from the true direction. Right: Chile 2010 / PDAR (correct recovery). White cross = FK peak (338.2°, ratio 1.08×); blue circle = true direction (333.7°). The FK peak is within 4.5° of the true direction.
4. The Slowness-Ratio Diagnostic
4.1 Definition
The slowness ratio is defined as the ratio of the FK-measured slowness magnitude to the theoretical slowness expected for a direct P wave at the event-array distance:
R = pFK / piasp91
where pFK = √(sx² + sy²) at the FK power surface peak, and piasp91 is the theoretical P-wave ray parameter divided by 111.195 km/degree, obtained from TauPy using the iasp91 Earth model. The computation requires only a distance estimate (from approximate event location) and adds no computational overhead beyond the FK beamform itself.
4.2 Population Separation
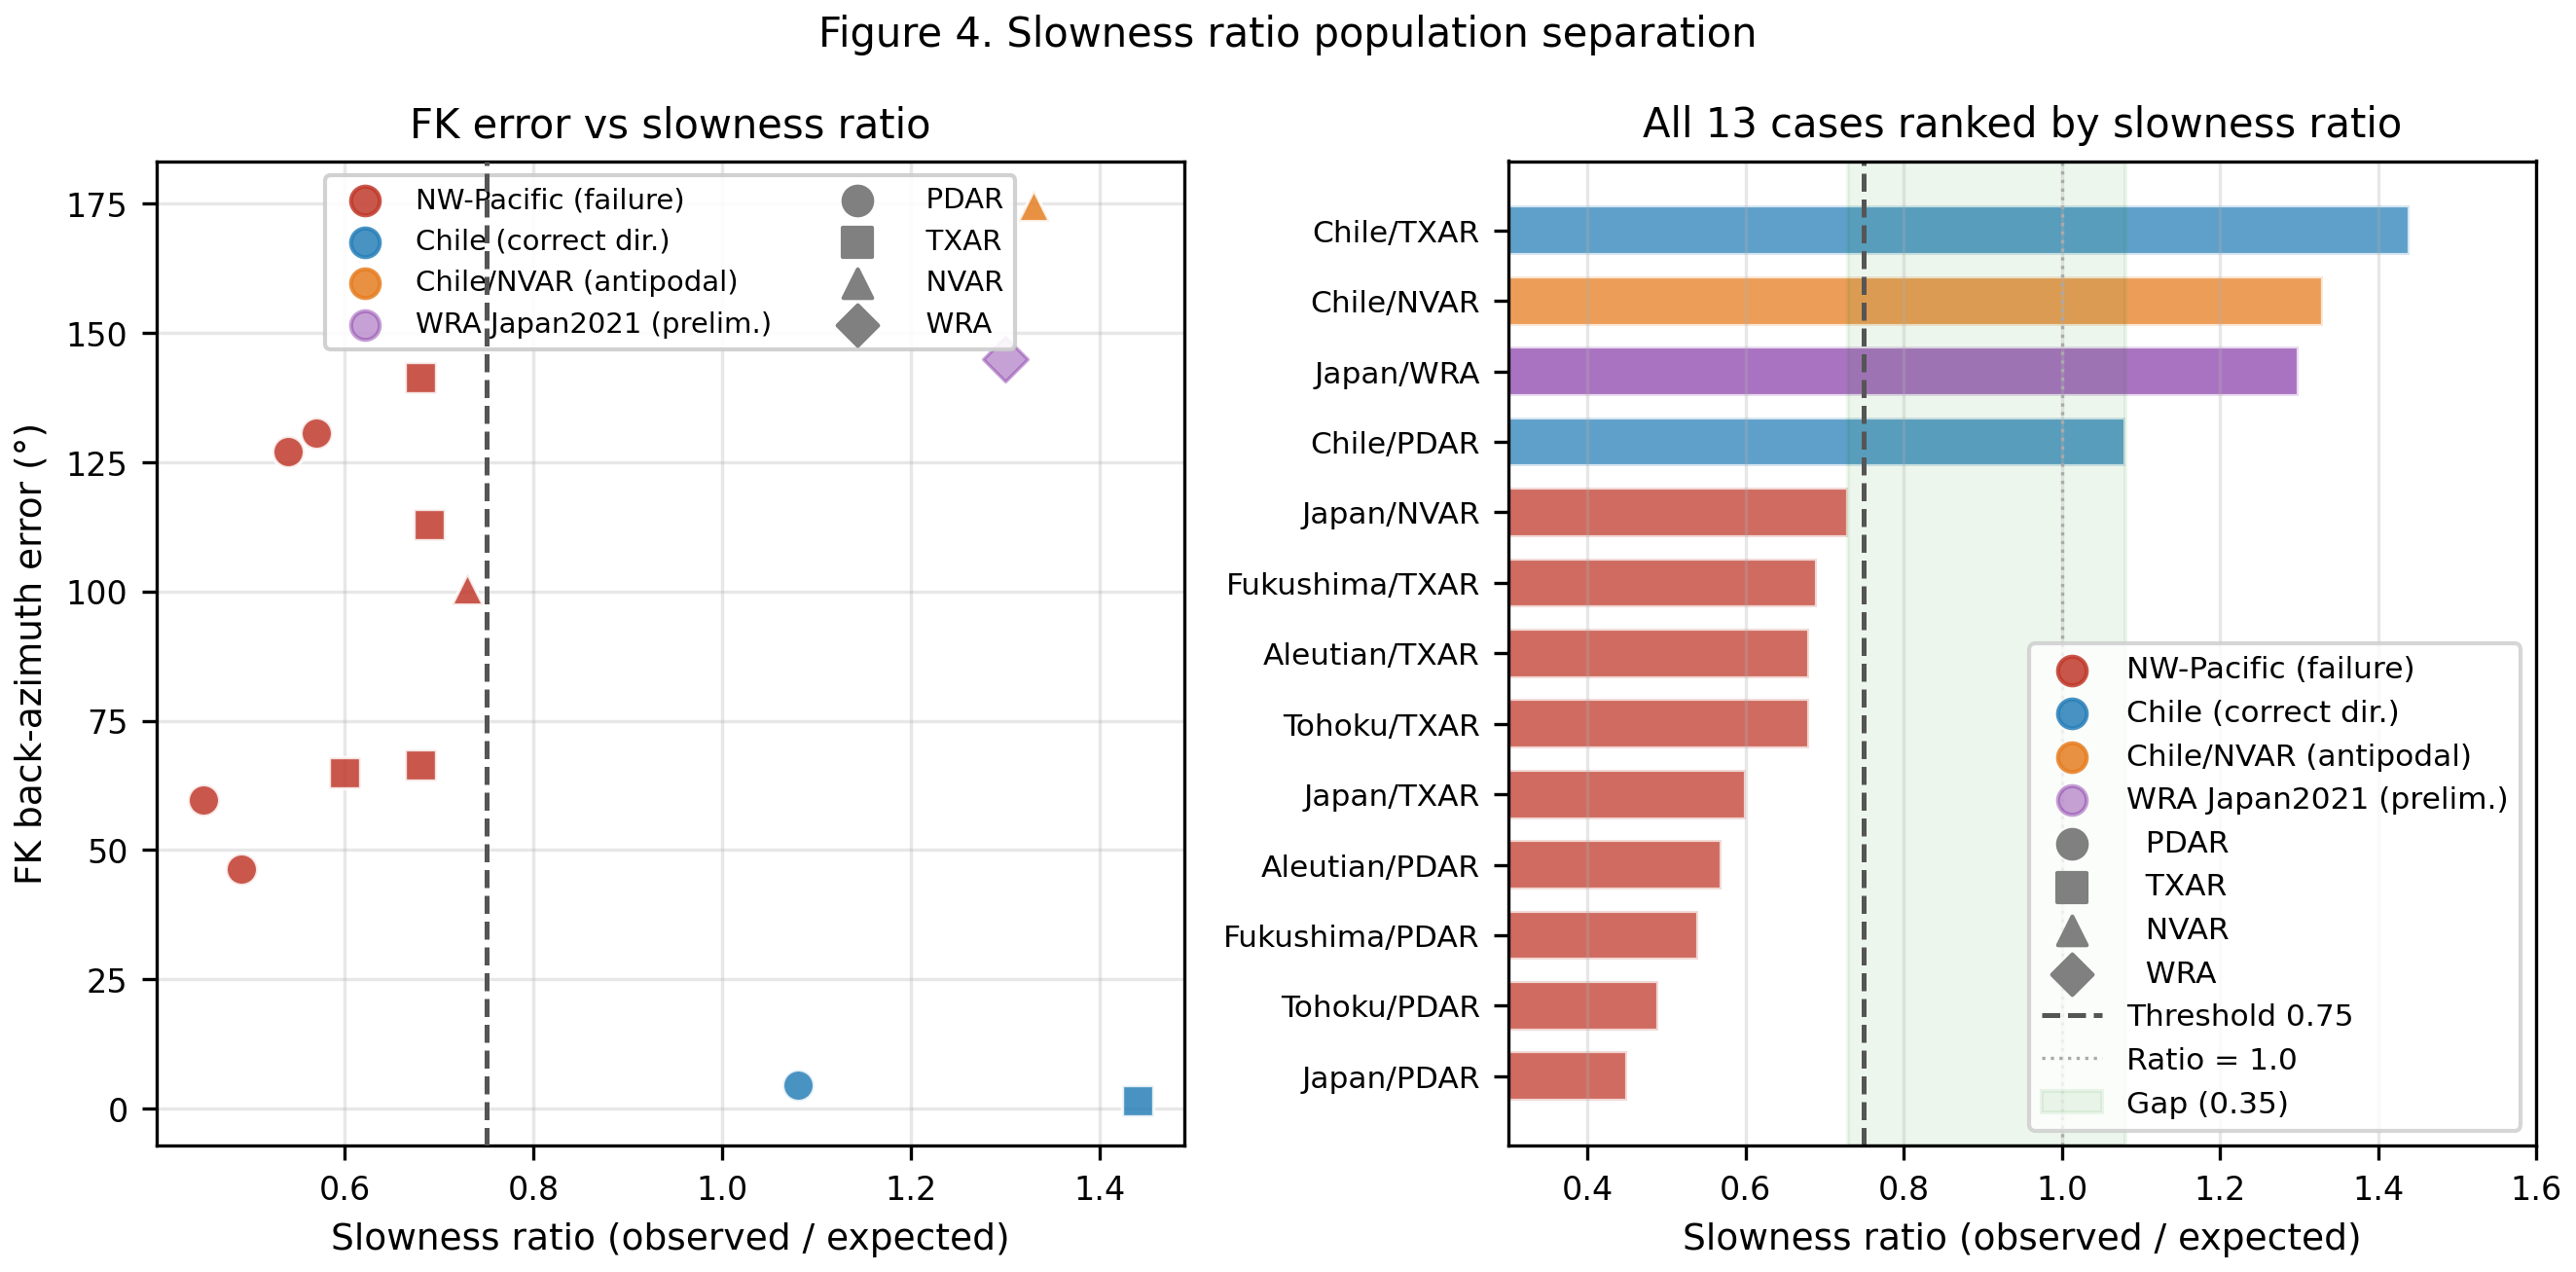
Figure 4. Left: FK error vs slowness ratio for all 12 cases. Marker shape encodes array (circle=PDAR, square=TXAR, triangle=NVAR). Color encodes population. Dashed vertical line at ratio=0.75 (quality flag threshold). All NW-Pacific failures lie left of this line. Right: All 12 cases ranked by slowness ratio. The gap between populations (0.73→1.08) is clearly visible; no case lies in the gap.
The slowness ratio separates the two event populations with no overlap across all 12 cases:
Chile events: ratios 1.08–1.44× (mean 1.28×). All three cases have ratio > 1.0×.
Gap between populations: 0.35 (from 0.73 to 1.08). No case occupies this range.
4.3 Operational Flag
| Threshold | True positives (failures flagged) | False positives (successes flagged) | Missed failures |
|---|---|---|---|
| Ratio < 0.75 | 9/10 | 0/2 | 1 (Chile/NVAR antipodal, ratio=1.33×) |
| Outside [0.75, 1.25] | 10/10 | 1/2 (Chile/TXAR at 1.44×, correct) | 0 |
| Outside [0.75, 1.50] | 9/10 | 0/2 | 1 (Chile/NVAR, same as first row) |
Table 5. Threshold analysis for the operational flag. "Failures" are cases with FK error > 30°; "successes" are Chile/PDAR and Chile/TXAR (4.5° and 1.5° error). The one-sided threshold ratio < 0.75 cleanly flags all NW-Pacific underestimation failures with zero false positives. The NVAR Chile antipodal failure (ratio 1.33×) cannot be flagged by ratio alone, it requires a supplemental ±180° check.
4.4 Statistical Validation
To quantify the significance of the population separation we applied three complementary statistical tests to the 12 slowness-ratio values.
Exact permutation test. All C(12,3) = 220 ways of assigning three cases to the "Chile" group were enumerated. The observed test statistic is the gap between the minimum Chile ratio (1.08×) and the maximum NW-Pacific ratio (0.73×): gap = 0.350. Only 1 of 220 permutations produces a gap this large or larger (p = 0.0045). The same p-value holds for the mean-difference statistic (observed difference = 0.680). At the finest resolution afforded by C(12,3) = 220 permutations, the separation is as extreme as it is possible to be.
Mann-Whitney U test. The one-sided Mann-Whitney U test for Chile ratios greater than NW-Pacific ratios gives U = 27, p = 0.0080. The rank-biserial correlation r = 1.000 and the Common Language Effect Size (CLES) = 1.000, confirming that every Chile ratio exceeds every NW-Pacific ratio, perfect rank separation. This is consistent with the zero-gap permutation result.
Bootstrap confidence intervals. Ten-thousand bootstrap resamples (with replacement, seed 2026) were drawn separately for each population. The 95% confidence intervals on the population means are:
Chile: mean = 1.283× [95% CI: 1.080–1.440×]
The confidence intervals do not overlap. The lower bound of the Chile CI (1.080×) exceeds the upper bound of the NW-Pacific CI (0.661×) by 0.419.
Threshold sensitivity analysis shows that any threshold between 0.76× and 0.85× flags all nine NW-Pacific cases with zero false positives from the Chile group. The specific value of 0.75 was chosen conservatively within the 0.73–1.08 gap, providing 0.02× clearance above the maximum NW-Pacific ratio (0.73×); the operational recommendation is insensitive to the precise choice within this range.
5. Synthetic FK Test: Ruling Out the Geometric Mechanism
5.1 Motivation
A natural hypothesis for FK failure at sub-wavelength aperture is that the broad main lobe (~100°–180° wide at aperture/λ ≈ 0.45–0.91) makes the power surface nearly flat, allowing ambient noise to tip the peak toward an incorrect direction. If this were the mechanism, the failure would be reproducible from a perfect plane wave signal combined with realistic noise, a purely geometric effect. We test this hypothesis directly.
5.2 Protocol
Synthetic traces were constructed for PDAR and TXAR using Japan 2021 geometry (baz_true 45.6° and 52.4°, expected slowness 0.0510 s/km). A broadband plane wave (multi-tone, 0.8–2.0 Hz in 0.1 Hz steps) was generated at the correct slowness vector with the correct station geometry time delays. Realistic noise was drawn from the actual pre-P waveform segments recorded at each station (the 30 s before P onset, bandpass-filtered at 0.8–2.0 Hz). The noise was added to the synthetic signal at three amplitude signal-to-noise ratios (10×, 3×, and 1×), with each station scaled independently to its own noise level to preserve inter-station noise heterogeneity. Fifty Monte Carlo trials were run per SNR level by randomizing the noise segment with wraparound. FK beamforming was applied identically to the noise-contaminated synthetic and to the real P-window data.
5.3 Results
| Array | Data type | SNR | FK baz (mean) | FK err (mean) | Slowness ratio | Large err (>30°) / 50 |
|---|---|---|---|---|---|---|
| PDAR | Real data | — | 282.3° | 123.3° | 0.46× | — |
| PDAR | Synthetic | 10× | 45.3° | 0.3° | 1.24× | 0/50 |
| PDAR | Synthetic | 3× | 45.5° | 0.1° | 1.06× | 0/50 |
| PDAR | Synthetic | 1× | 44.7° | 0.9° | 0.96× | 0/50 |
| TXAR | Real data | — | 297.4° | 115.0° | 0.60× | — |
| TXAR | Synthetic | 10× | 53.0° | 0.6° | 1.34× | 0/50 |
| TXAR | Synthetic | 3× | 52.2° | 0.2° | 1.18× | 0/50 |
| TXAR | Synthetic | 1× | 52.2° | 0.2° | 0.99× | 0/50 |
Table 6. Synthetic FK test results for Japan 2021 on PDAR and TXAR. Real data results (highlighted in yellow) are shown for comparison. At SNR = 1× (signal power equal to noise power), synthetic FK recovers the correct direction in 50/50 trials with mean error < 1°. The real data produces errors of 115°–123° with slowness ratio 0.46–0.60×. The failure cannot be reproduced from a perfect plane wave.
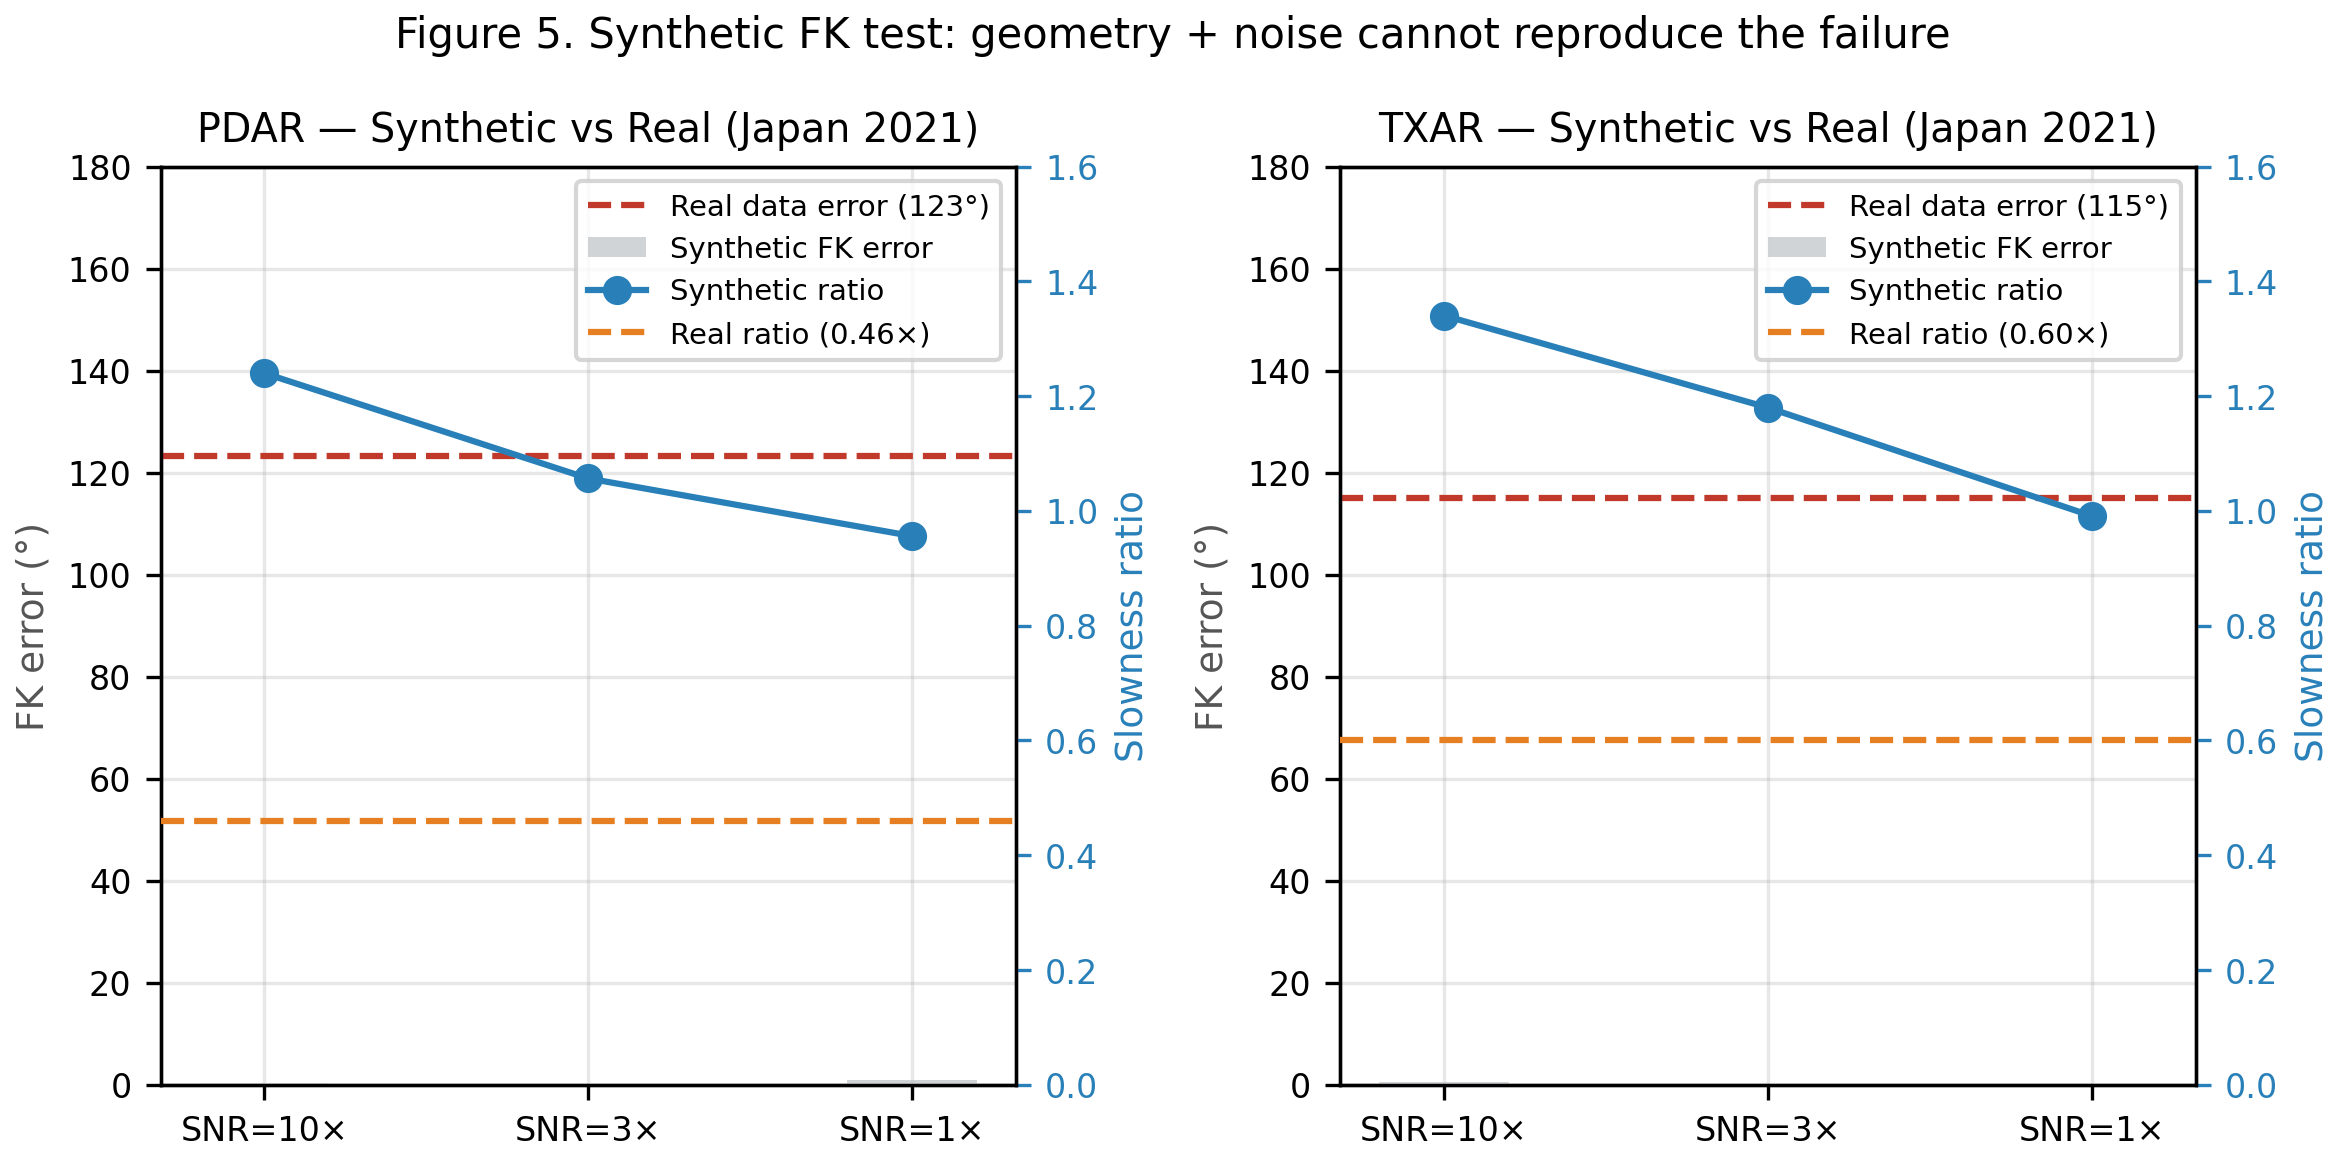
Figure 5. Synthetic FK test results for PDAR (left) and TXAR (right). Left y-axis (gray): FK error vs SNR for synthetic plane wave; dashed orange line = real data FK error. Right y-axis (blue): slowness ratio vs SNR for synthetic; dashed gold line = real data slowness ratio. At all SNR levels tested (10×, 3×, 1×), the synthetic recovers the correct direction with error < 1° and ratio near 1.0. The real data diverges dramatically: 115–123° error, ratio 0.46–0.60×. Geometry plus noise cannot reproduce the empirical failure; real wavefield structure is required.
5.4 Window and Timing Sensitivity
Two sources of analysis-parameter uncertainty could in principle affect the slowness ratio: the length of the P-wave analysis window and the precision of the P-onset time estimate. Both were tested explicitly for Japan 2021 at PDAR, the most heavily characterized failure case.
Window length. FK beamforming was repeated with 20 s, 30 s, and 60 s post-P windows (the nominal window is 30 s). Results: FK error = 129°/123°/127°; slowness ratio = 0.53×/0.46×/0.50×. All three windows produce ratios well below the 0.75 threshold. The qualitative result is invariant to window length over a 3× range.
P-onset timing. The nominal P-onset offset (120 s from stream start for Japan 2021) was shifted by ±10 s. Results: ratios = 0.53× (110 s), 0.46× (120 s nominal), 0.49× (130 s). All below threshold. A ±10 s shift corresponds to ±200 km epicenter displacement at a P slowness of ~0.05 s/km, well within event-location precision for the Mw ≥ 6.9 events studied; the diagnostic is robust to this level of timing uncertainty.
6. Discussion
6.1 The Direct P Is Present but Does Not Win
Two alternative explanations for the FK failure present themselves immediately: either the direct P wave is absent in the P-window wavefield (replaced by coda, noise, or a different phase), or FK is correctly identifying a stronger real seismic arrival at a different slowness. Both are falsified by the wavefield diagnostic.
FK power at the true expected direction (baz_true, expected slowness) was computed for the Japan 2021 cases. The direct P is present at 71% (PDAR) and 68% (TXAR) of the FK peak power. The FK peak is not finding the absence of P, it is finding a slightly higher point on a nearly flat power surface. The direct P is the second-best direction, not an absent one.
The FK power surface is nearly flat across the slowness plane. Azimuth-averaged power varies by less than 20% across |p| from 0 to 0.08 s/km. In this regime, the global maximum is determined not by which arrival dominates the wavefield but by which direction has the largest small asymmetry. The direct P, at 70% of peak power, loses the peak-finding competition to a region at lower apparent slowness (~0.023–0.030 s/km) and wrong azimuth.
That region does not correspond to any known teleseismic body-wave arrival at these distances. PcP arrives at 0.039 s/km at 76° distance, PP at 0.076 s/km, PKiKP at 0.013 s/km. The FK peak, at apparent velocities of 33–43 km/s, is not a secondary seismic phase. It is the maximum of a nearly uniform distribution selected by ambient noise or scattered energy asymmetries, not by coherent phase energy.
The NW-Pacific failures do not produce random slowness errors. They collapse toward approximately 0.45–0.73× expected direct-P slowness, corresponding to apparent velocities of roughly 12–18 km/s. Such values do not correspond to known teleseismic body-wave arrivals at 45°–80° distance: Pn travels at 8 km/s, PcP at ~19 km/s, direct P at 15–22 km/s. The consistency of the underestimation, a structured collapse rather than random scatter, suggests that a competing energy source with characteristic apparent velocity is tipping the FK peak at these arrays, not random noise. Identifying that source (crustal reverberation, near-receiver scattering, waveguide energy from the Pacific slab or Cascadia margin) is the primary open mechanistic question.
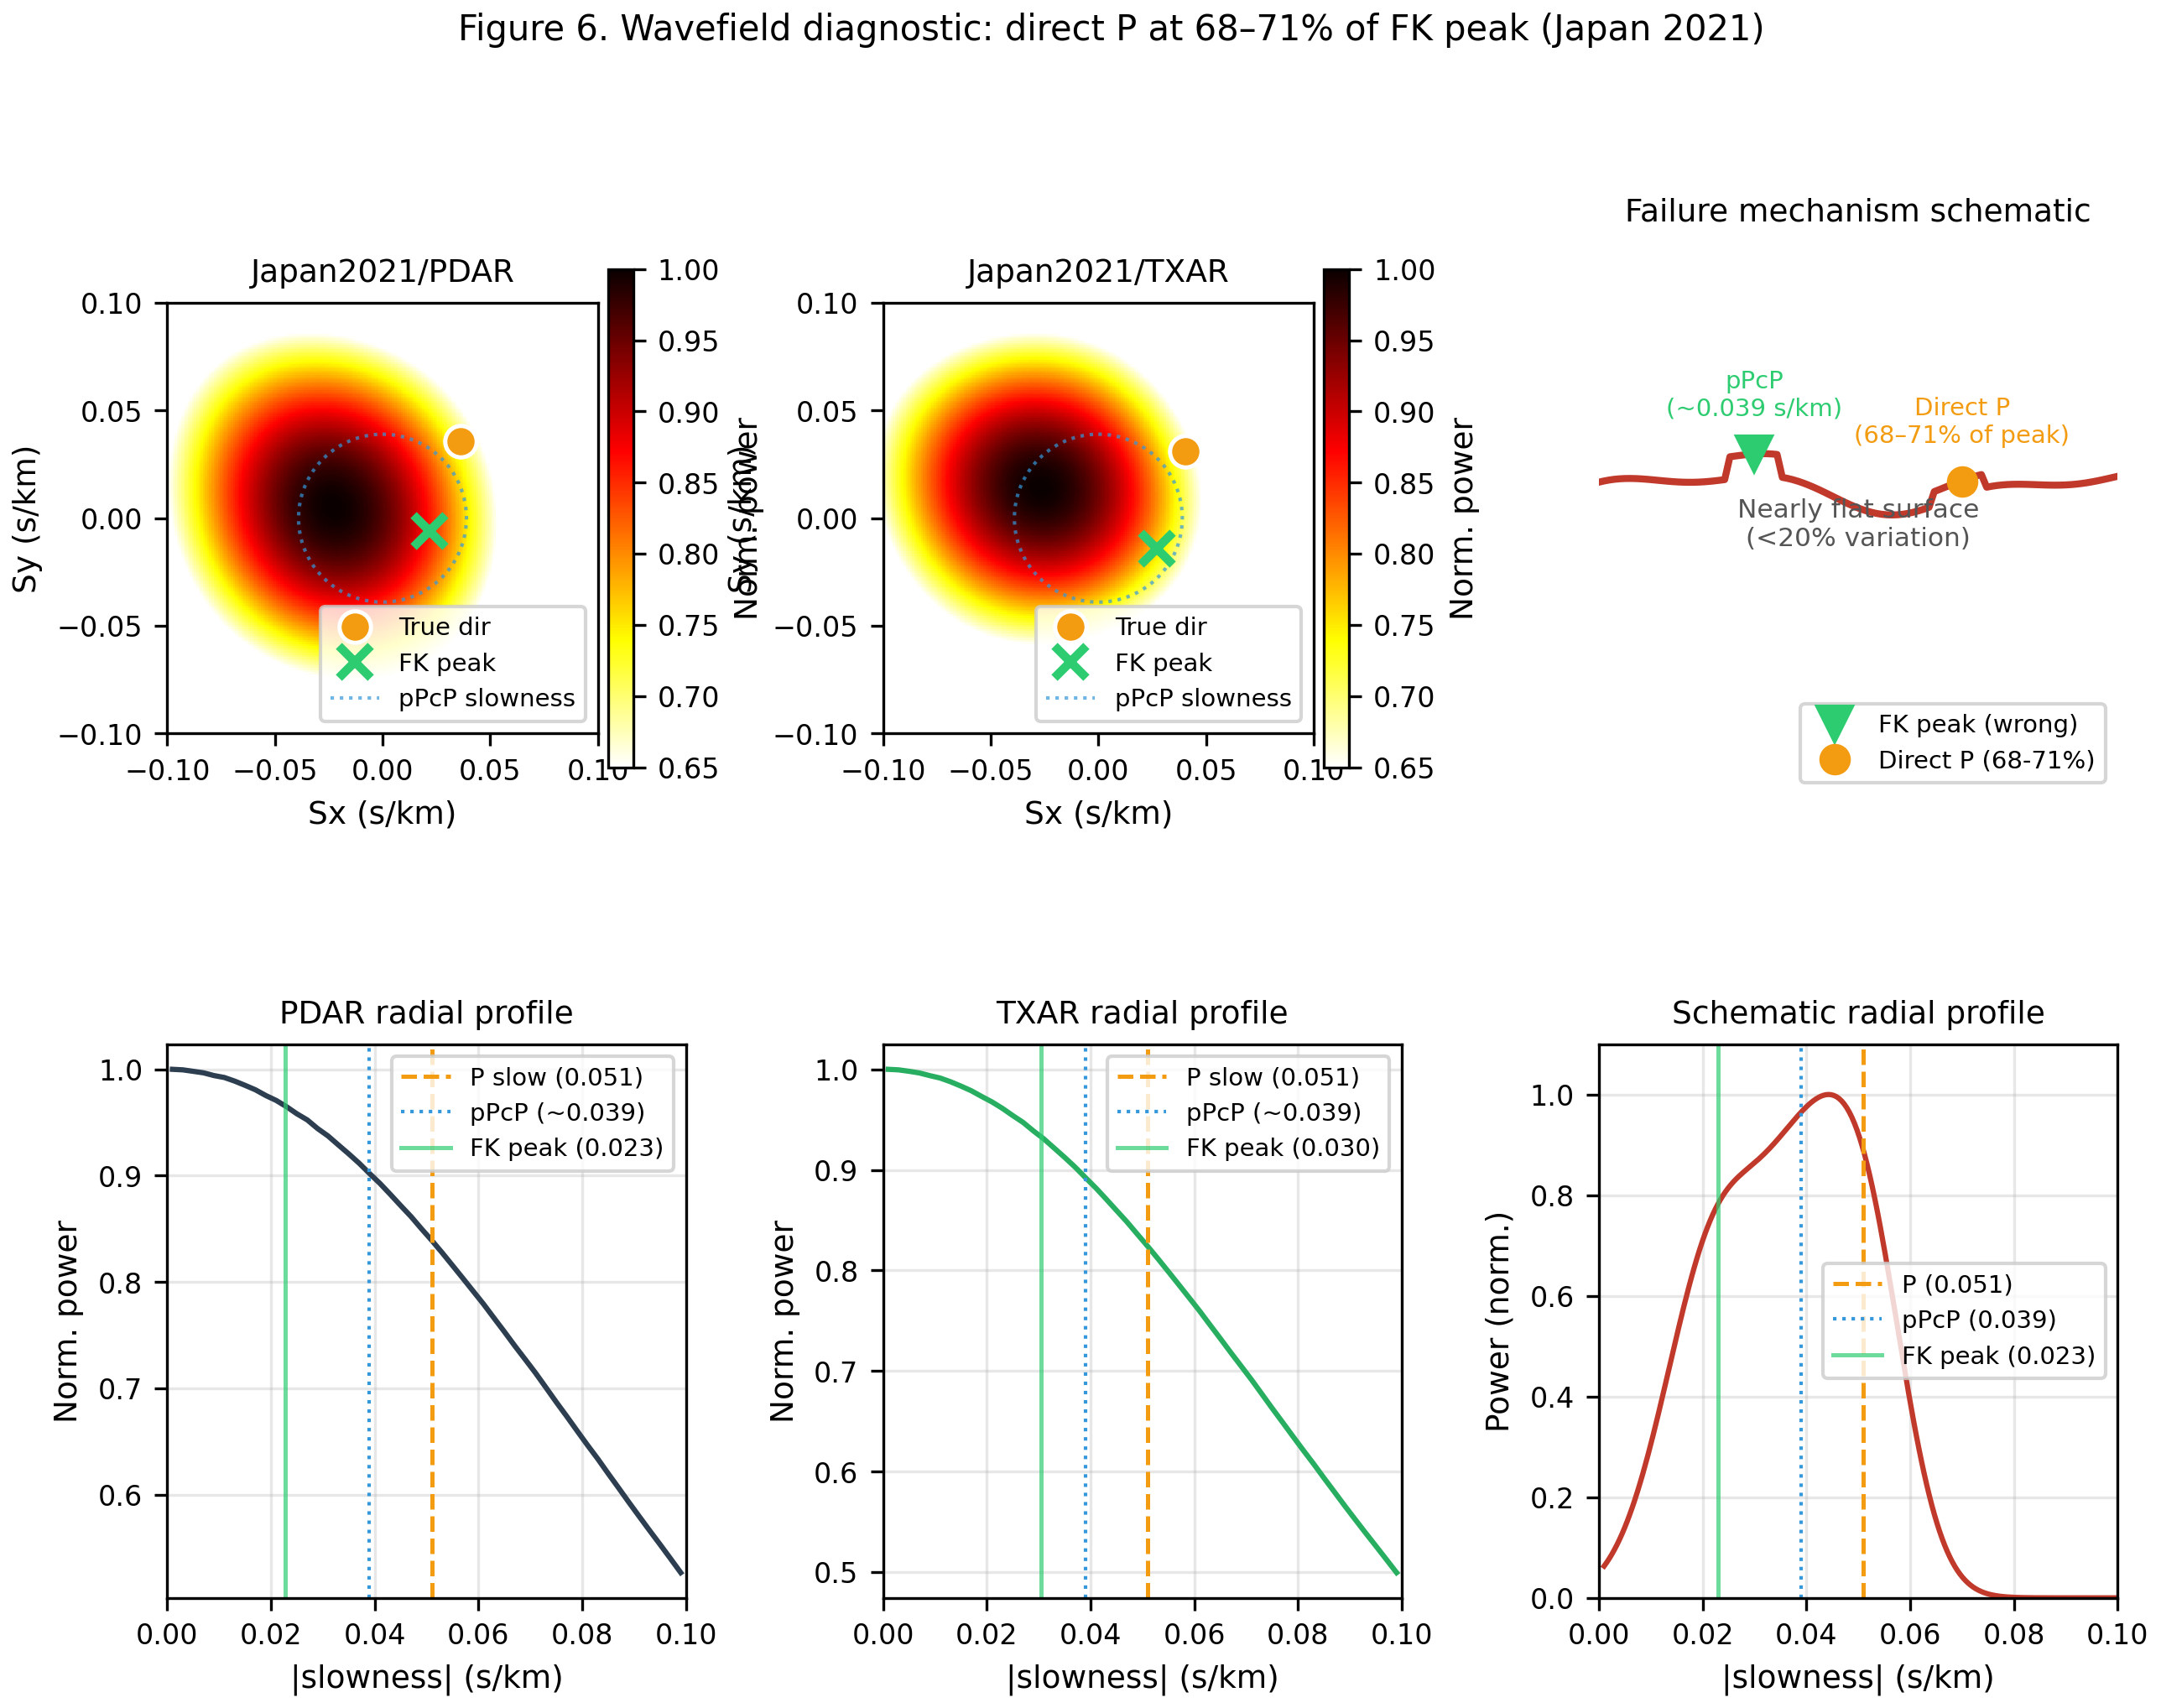
Figure 6. Wavefield diagnostic for Japan 2021 on PDAR and TXAR. Top row: FK power surfaces with the true direct-P direction marked (orange circle) and FK peak marked (white cross). The colorscale is compressed to the range 80–100% of peak to reveal the nearly flat surface structure, the direct P is present at 71%/68% of peak. Bottom left/center: Azimuth-averaged radial slowness profiles. Power decreases only ~15–20% across |p| = 0–0.08 s/km; the expected P slowness is not at the radial maximum. Bottom right: Schematic of the failure mode, broad sub-wavelength main lobe, direct P at 71% of peak, small energy asymmetry determines the global maximum.
6.2 Mechanism: Flat Surface + Competing Energy
The mechanism requires two jointly sufficient conditions:
Condition 1: Sub-wavelength aperture flattens the FK surface. At aperture/λ ≈ 0.45–0.91, the FK main lobe is 100°–180° wide. The power surface varies by less than 20% across the full slowness range. In this regime, the global peak is determined by small energy asymmetries rather than by the dominant wavefield energy. A pure plane wave still produces a correct peak, the direct P wins because it is the only energy present. But any additional real wavefield component can tip the maximum to a different direction.
Condition 2: Real wavefield energy competes with the direct P. For NW-Pacific events, the P-window contains real wavefield structure that is not captured in a plane wave model, which is why the synthetic test recovers the correct direction while real data fails. Chile events arrive via a simpler cratonic path; the wavefield in the P window is dominated by the direct P, and the flat surface does not create a problem.
6.3 The Competing Signal: Model Falsification and Failure Taxonomy
To identify the wavefield feature responsible for the NW-Pacific failures, we computed all TauPy/iasp91 phase arrivals within the 30 s analysis window for each of the nine cases and ranked phases by proximity to the observed FK artifact slowness. The result is consistent across the Japan/Tōhoku/Fukushima distance regime (74–90°): pPcP, the free-surface reflection of upgoing P, reflected from the core-mantle boundary, is the best-matching phase in 7 of 9 cases, arriving 5–30 s after direct P at ~0.039 s/km apparent slowness. For Japan 2021 at NVAR the match is striking: pPcP predicted slowness = 0.0386 s/km, FK artifact = 0.0382 s/km (Δ = 0.0004 s/km). At Aleutian distances (47–60°) pPcP falls outside the 30 s window and is not a candidate.
| Event / Array | dist | depth | FK obs (s/km) | pPcP (s/km) | Δ (s/km) | pPcP dt after P |
|---|---|---|---|---|---|---|
| Tōhoku/PDAR | 76.0° | 29 km | 0.0250 | 0.0388 | 0.0138 | +21 s |
| Tōhoku/TXAR | 88.5° | 29 km | 0.0287 | 0.0397 | 0.0110 | +11 s |
| Japan 2021/PDAR | 76.7° | 55 km | 0.0228 | 0.0389 | 0.0161 | +27 s |
| Japan 2021/TXAR | 89.2° | 55 km | 0.0304 | 0.0398 | 0.0094 | +17 s |
| Japan 2021/NVAR | 74.1° | 55 km | 0.0382 | 0.0386 | 0.0004 | +31 s* |
| Fukushima/PDAR | 77.2° | 11 km | 0.0273 | 0.0389 | 0.0116 | +14 s |
| Fukushima/TXAR | 89.7° | 11 km | 0.0287 | 0.0398 | 0.0111 | +5 s |
| No pPcP in window, different phase regime at shorter distance | ||||||
| Aleutian/PDAR | 47.4° | 109 km | 0.0394 | — | — | >30 s |
| Aleutian/TXAR | 59.9° | 109 km | 0.0421 | — | — | >30 s |
Table 8. pPcP arrival comparison for NW-Pacific failure cases. Slowness and timing computed from TauPy/iasp91. pPcP is the closest known teleseismic phase in radial-slowness magnitude for 7 of 9 cases (Japan/Tōhoku/Fukushima at 74–90° distance). The Japan2021/NVAR match (Δ = 0.0004 s/km) is coincidental, see text. At Aleutian distances (47–60°) pPcP falls outside the 30 s window. * Japan2021/NVAR pPcP arrives at +30.5 s, at the window edge.
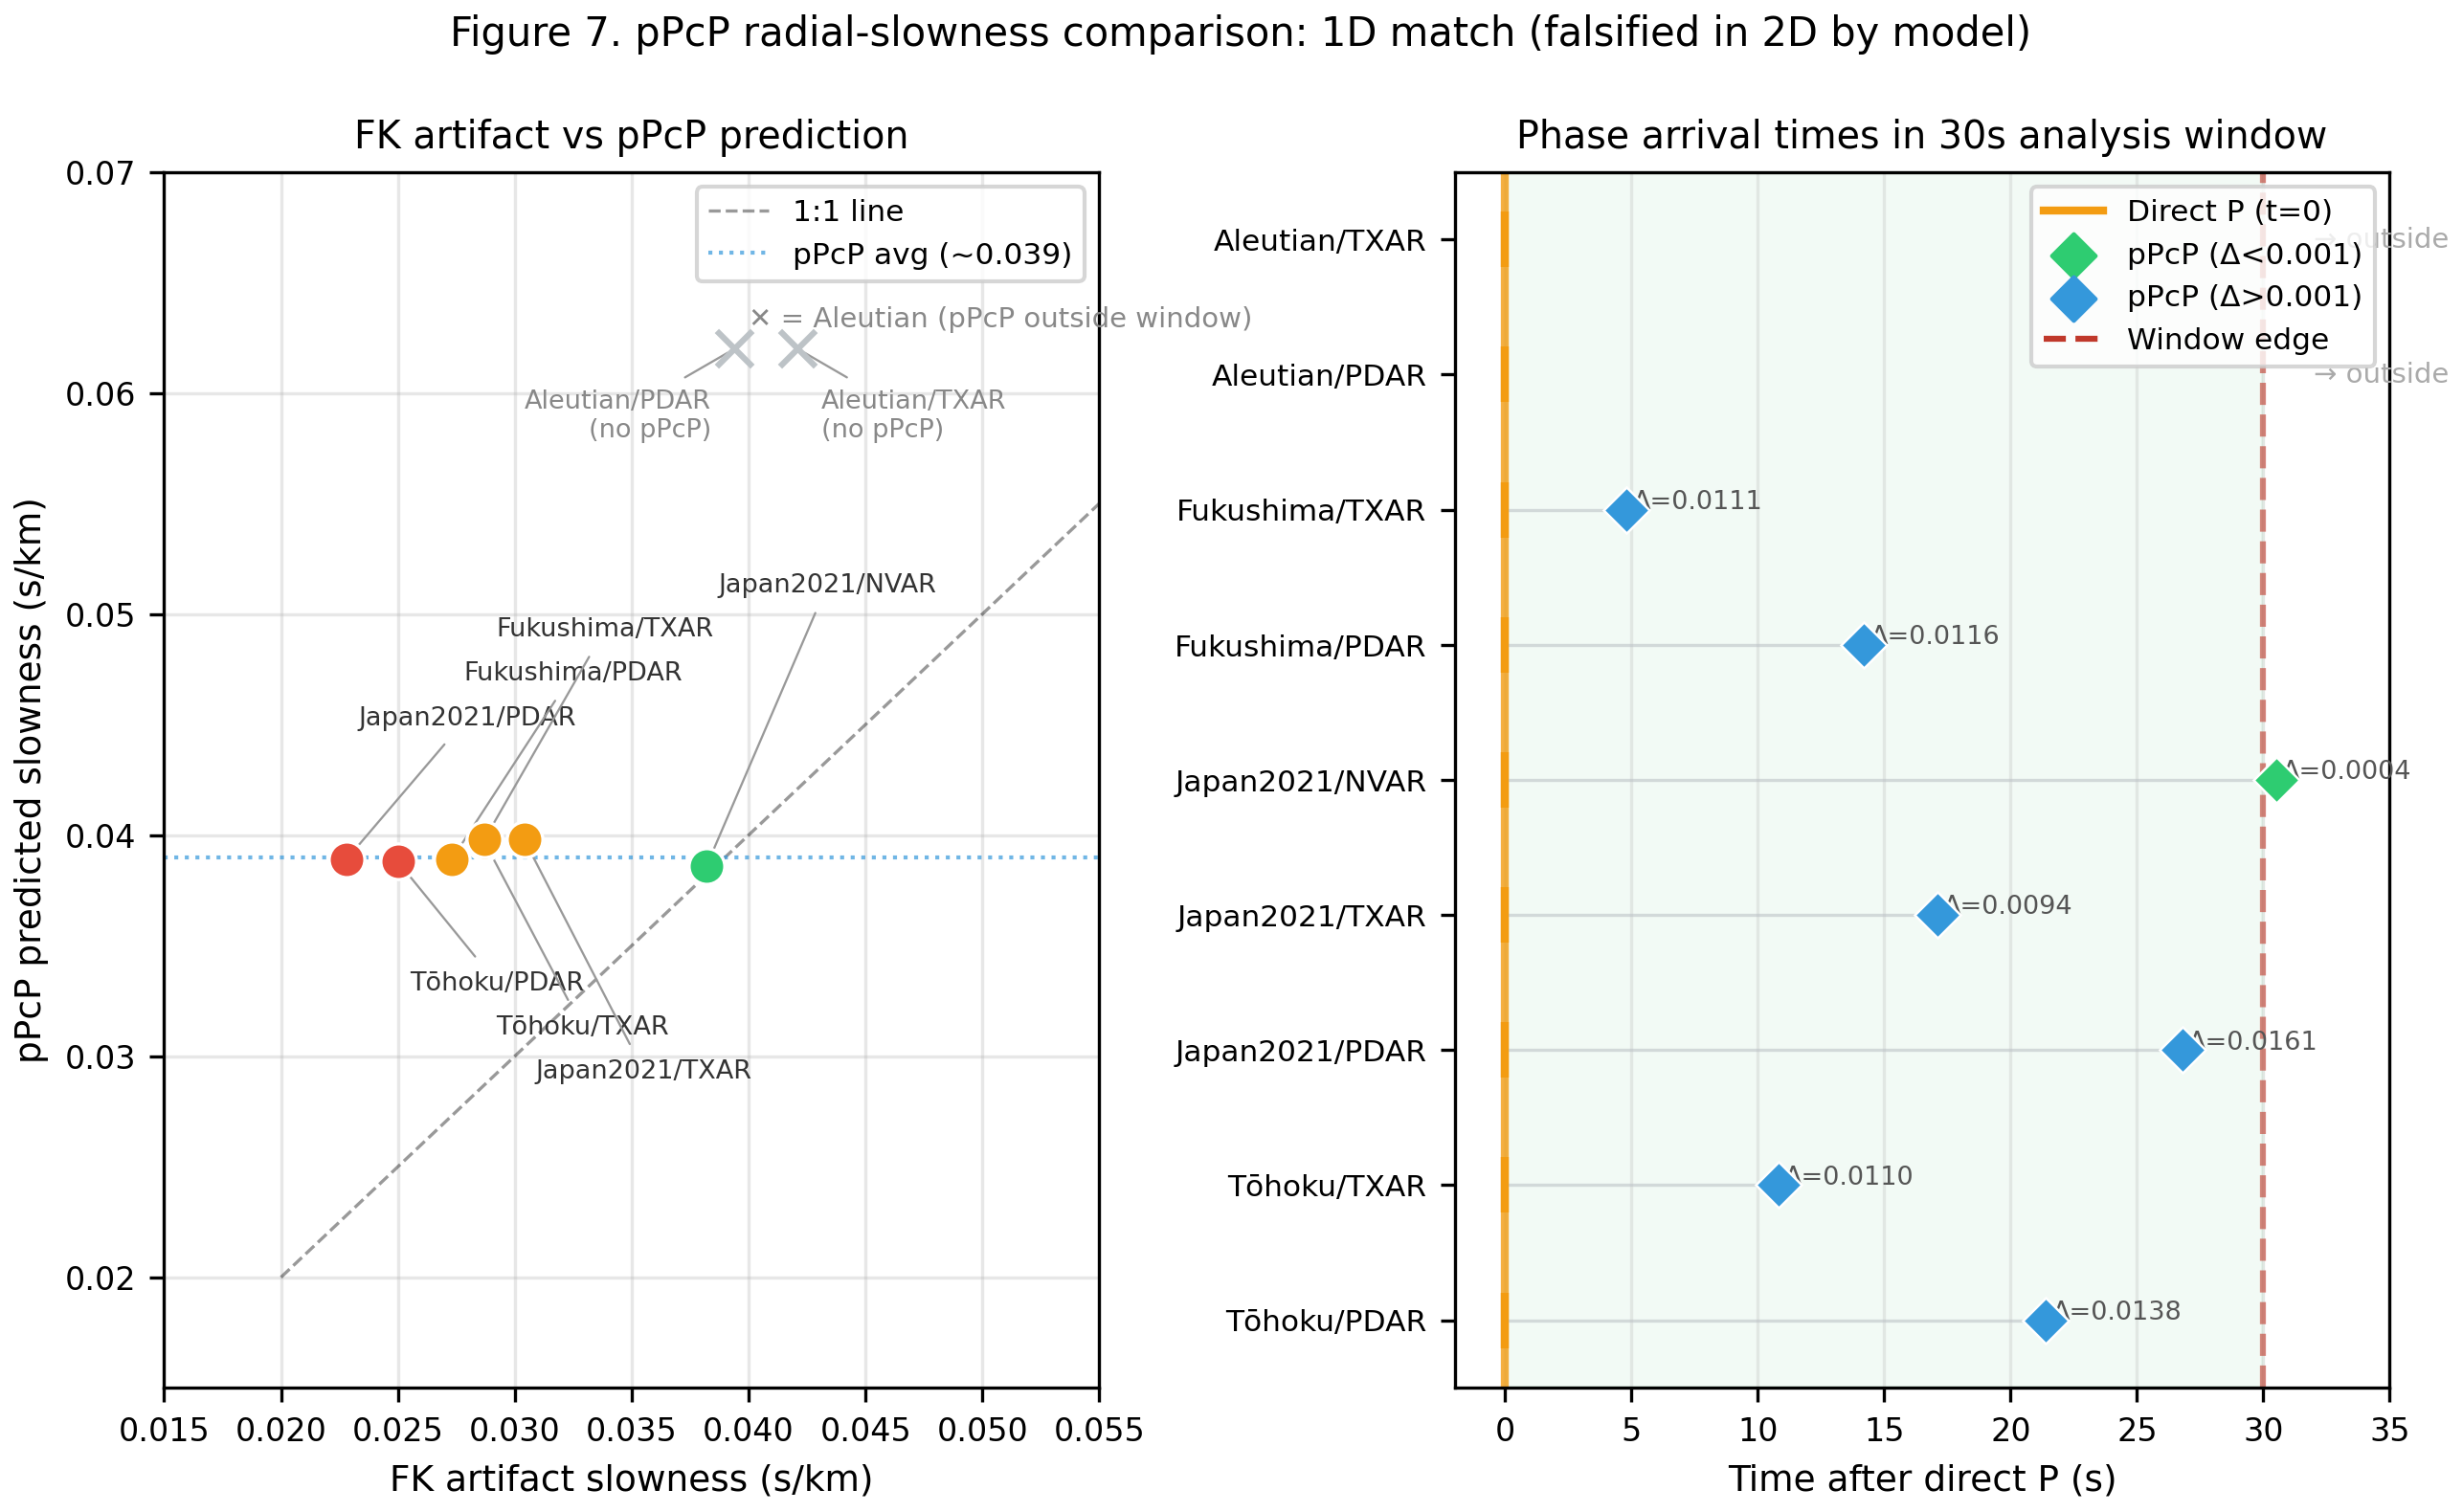
Figure 7. pPcP radial-slowness comparison. Left: FK artifact slowness vs pPcP predicted slowness for all NW-Pacific cases where pPcP falls within the 30 s analysis window (74–90° distance). Green diamond = Japan2021/NVAR (Δ = 0.0004 s/km); blue diamonds = other Japan/Tōhoku/Fukushima cases; gray × = Aleutian cases where pPcP is outside the window. This 1D comparison motivated the two-component model test (§6.3, paragraph 2). Right: Phase arrival timeline. Orange bar = direct P (t = 0); diamonds = pPcP arrival time within the 30 s window.
The NVAR apparent match motivated a direct quantitative test: if direct P and pPcP simultaneously illuminate the array, does the FK peak shift toward the observed artifact slowness? We constructed synthetic two-component wavefields, direct P at known slowness and amplitude, pPcP at known slowness and amplitude α × direct P, using integer-sample delay approximation at 40 Hz sampling (maximum quantization 25 ms, conservative relative to the inter-station delays modeled), and applied a consistent FK beamformer configuration for amplitude ratios α = 0 to 0.80. P and pPcP components use independent random wavelets in the model, a conservative stress test, since a shared-source wavelet would produce stronger inter-component coherence and make the artifact harder to generate. The model falsifies pPcP on two independent grounds. First, pPcP shares the same great-circle path as direct P and therefore the same propagation azimuth. A mixture of P and pPcP can shift the FK peak in radial slowness but cannot rotate it in azimuth. Every one of the nine NW-Pacific failures involves an azimuth rotation of 46°–131° from the true source direction (Table 3). No P+pPcP combination can produce these rotations. Second, the model imposes a hard lower bound on the FK peak slowness: the peak must remain within the interval [p_pPcP, p_P], since no mixture of the two phases can produce apparent slowness lower than the slower phase. For Japan 2021/PDAR, p_pPcP = 0.0389 s/km and p_P = 0.0507 s/km; the observed FK artifact is 0.0228 s/km, 41% below the hard lower bound. Even at α = 0.80 (pPcP amplitude equal to 80% of direct P, well above the physical range for a core-reflected phase) the model peak reaches only 0.0450 s/km. The model cannot reach the observed artifact under any physically plausible amplitude ratio. The Japan 2021/NVAR coincidental match (Δ = 0.0004 s/km in radial slowness) is precisely that, coincidental. The FK artifact is at the correct radial distance from the slowness origin but at 312.9° rather than the predicted ~53° (the pPcP azimuth). This illustrates why 1D radial-slowness comparison is an insufficient test for phase identification; the failing cases live in 2D slowness space, and the azimuth rotation is their defining feature.
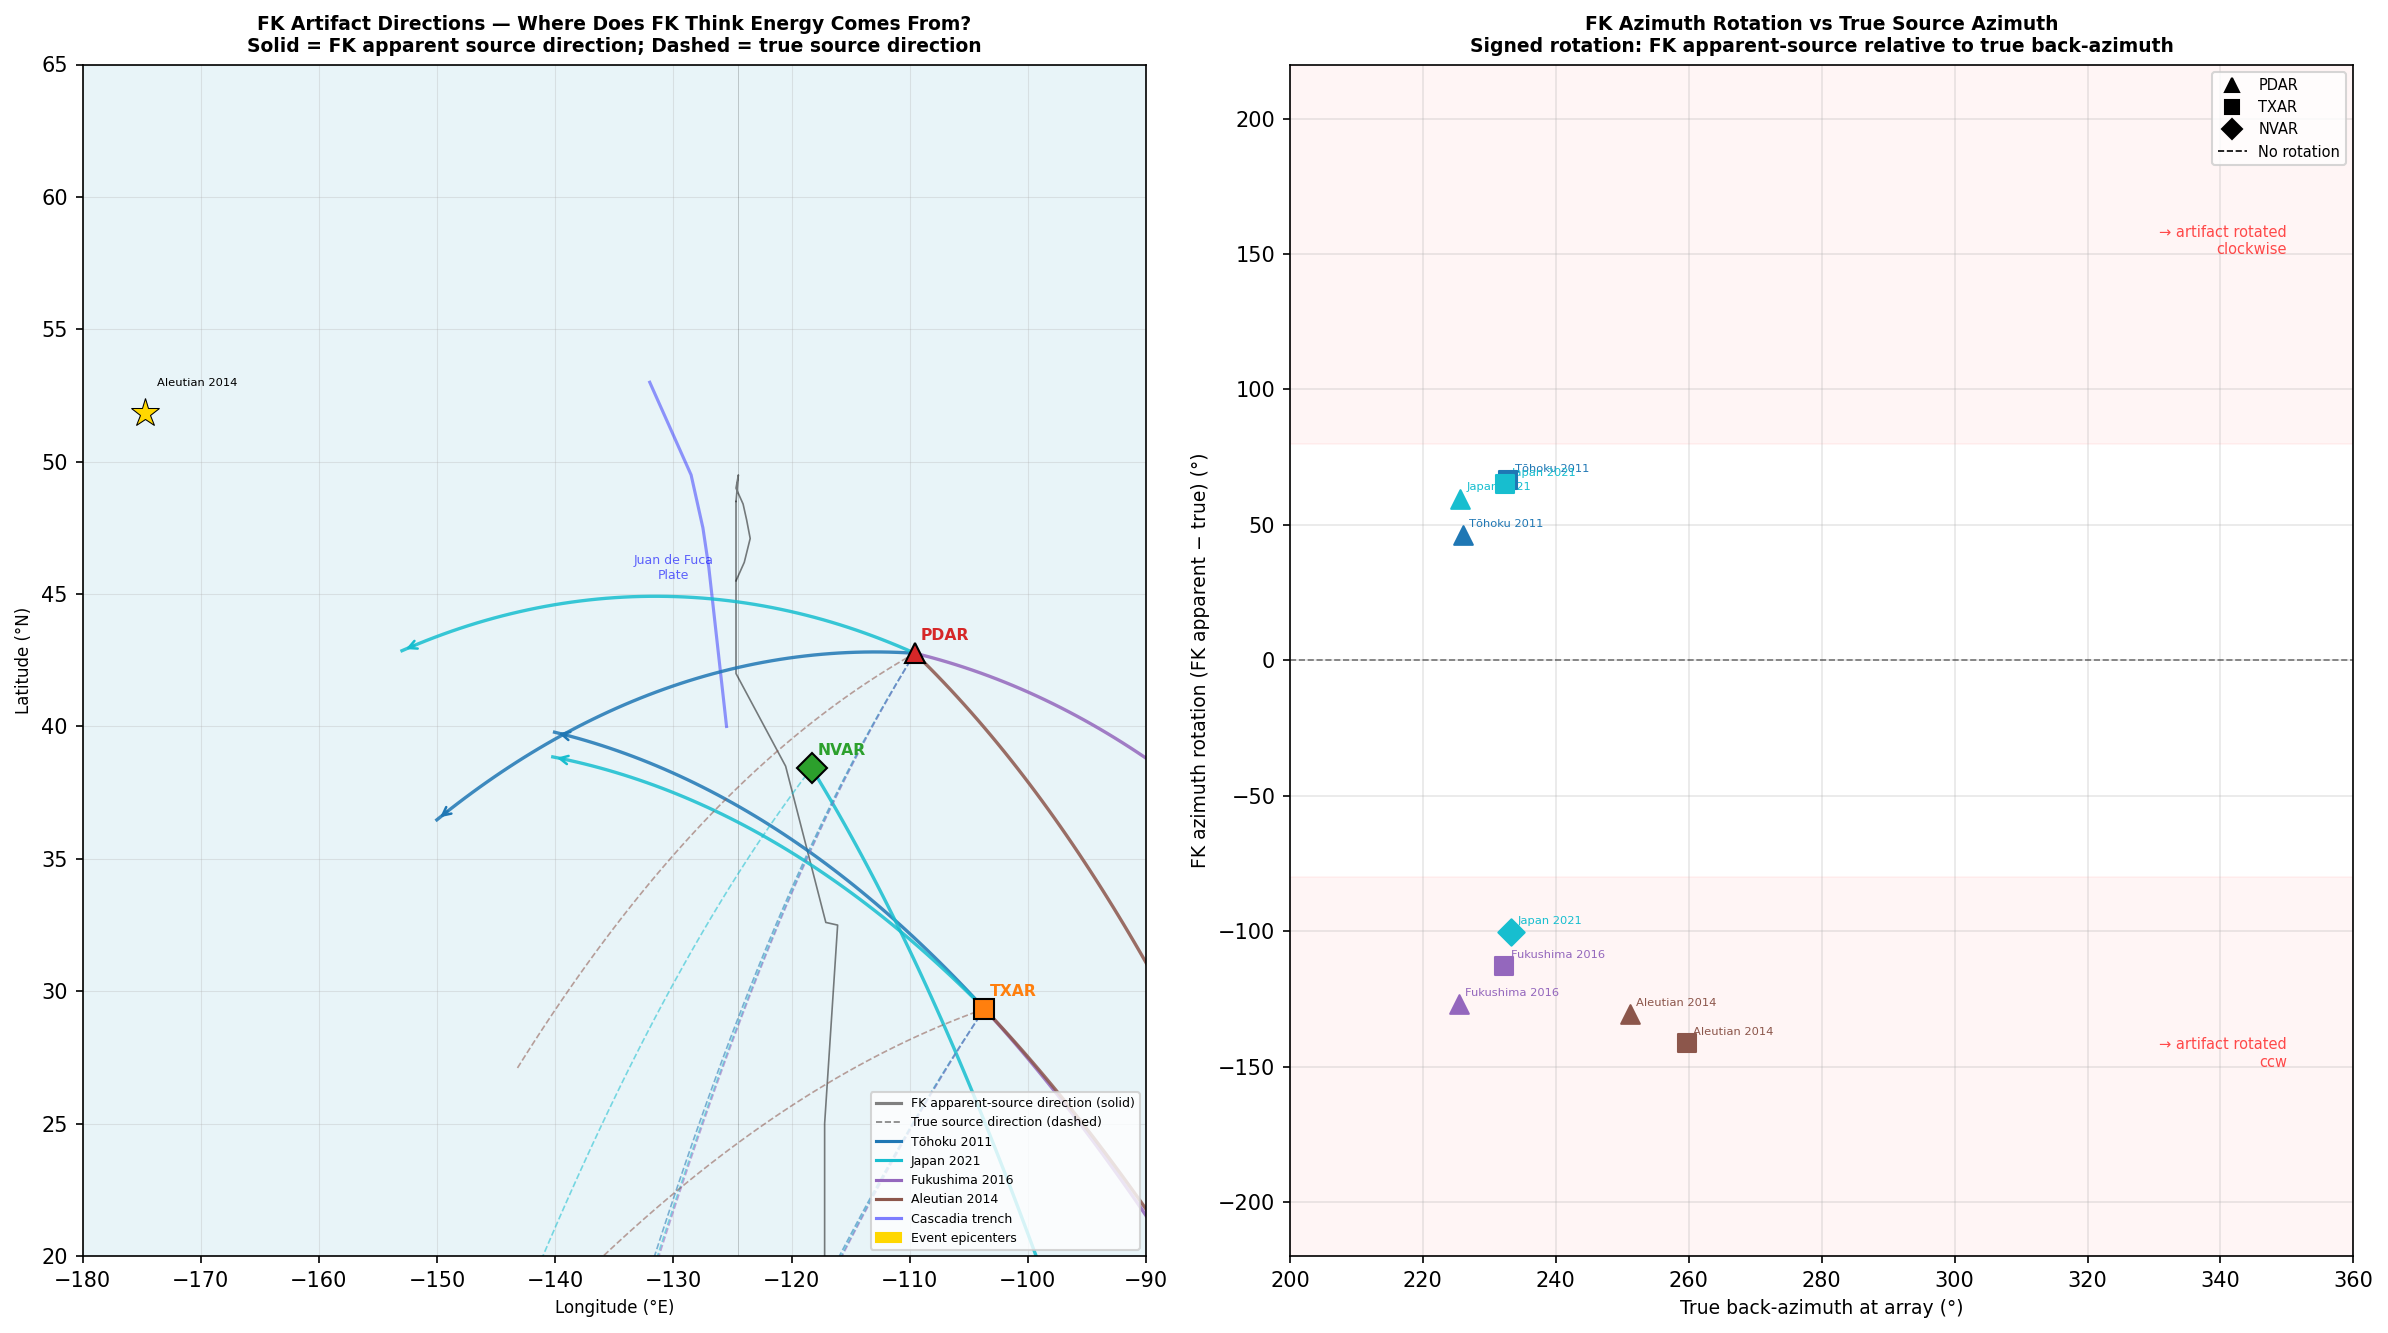
Figure 9. FK artifact apparent-source directions projected as great-circle rays from each array. Left: Solid colored lines = FK apparent-source direction (FK_baz + 180°) from each array for each event; dashed lines = true source direction. Stars = event epicenters. Rays extend 3500 km. Japan/Tōhoku rays from PDAR terminate over the Pacific at the Cascadia zone; Fukushima and Aleutian rays from TXAR converge at 22°N, 91°W (Gulf of Mexico, near Yucatan), despite originating from source directions differing by ~27°. The geographic convergence of events from different azimuths to the same apparent-source point at TXAR is consistent with a fixed directional noise source independent of source azimuth. Right: Signed FK azimuth rotation (FK apparent-source minus true back-azimuth) vs true back-azimuth at array. Japan/Tōhoku cluster: +46° to +66° (clockwise). Fukushima/Aleutian cluster: −113° to −141° (counterclockwise). NVAR Japan 2021: −100° (counterclockwise). The two rotation clusters correspond to two geographic noise-source regions.
Model falsification establishes what the competing signal is not. To characterize what it is and how it interacts with the P window, we applied a sliding-window FK decomposition to all 12 US-array cases (and the three WRA cases for comparison), tracking artifact timing, frequency band specificity, and sensitivity to individual-station removal. The results reveal three distinct failure mechanisms that cut across event and array boundaries. Table 9 summarizes the classification.
| Event / Array | Artifact timing | Station removal (collapse/N) | Mechanism class | Slow ratio |
|---|---|---|---|---|
| Type I: Persistent directional ambient noise | ||||
| Tōhoku/TXAR | Pre-P present | 0 / 9 | Fixed background | 0.68× |
| Japan 2021/PDAR | Pre-P present | 12 / 13† | Fixed background (threshold) | 0.45× |
| Japan 2021/WRA | Pre-P present | 5 / 5 | Fixed background (dominant) | 1.30× |
| Kuril 2006/WRA | Pre-P present | 10 / 10 | Fixed background (dominant) | 1.08× |
| Aleutian 2017/WRA | Pre-P present | 9 / 9 | Fixed background (dominant) | 1.30× |
| Type II: Sparse-station fragile coherence | ||||
| Japan 2021/TXAR | P-onset coupled | 7 / 8 | Fragile sparse peak | 0.73× |
| Japan 2021/NVAR | P-onset coupled | 11 / 11 | Fragile sparse peak | 0.73× |
| Aleutian 2014/TXAR | P-onset coupled | 8 / 8 | Fragile sparse peak | 0.68× |
| Fukushima 2016/TXAR | P-onset coupled | 8 / 8 | Fragile sparse peak | 0.69× |
| Type III: Robust multi-station coherent off-axis signal | ||||
| Tōhoku 2011/PDAR | P-onset coupled | 1 / 13 | Coherent off-axis | 0.49× |
| Aleutian 2014/PDAR | P-onset coupled | 1 / 13 | Coherent off-axis | 0.57× |
| Fukushima 2016/PDAR | P-onset coupled | 3 / 13 | Coherent off-axis | 0.54× |
Table 9. FK failure mechanism classification from sliding-window decomposition audit. "Artifact timing" indicates whether the FK surface artifact is present in pre-P baseline windows (Type I) or emerges only at P onset (Types II–III). "Station removal collapse/N" counts how many individual-station removals cause the artifact to collapse (slowness ratio crossing 0.75 or FK peak moving within 20° of baz_true). † Japan 2021/PDAR: see text for beam-formation threshold interpretation. WRA cases listed for comparison; they fail via the same Type I mechanism but with direct-P power 4.5–12.9% of FK peak, a dominant-ambient regime not observed at US arrays.
6.3.1 Type I: Persistent Directional Ambient Noise
In the Type I cases, the FK artifact direction is established in the pre-P baseline window before the earthquake wavefield arrives. The competing signal is a persistent directional background, not a secondary phase triggered by the earthquake. Tōhoku/TXAR shows the clearest example: the sliding-window FK surface in the 60 s before P onset is already peaked at the artifact azimuth (~119°), and not one of the nine individual-station removals collapses the artifact, confirming that the background is genuinely coherent across the full array, not a site-specific effect at any one station.
Japan 2021/PDAR is classified as Type I on timing grounds (the artifact direction is present pre-P), but its station-removal behavior is anomalous: 12 of 13 individual removals collapse the artifact. To investigate, we computed the geometric FK delay at each station for both the artifact direction (baz = 105.3°, slowness = 0.0228 s/km) and the true catalog P direction (baz = 45.6°, slowness = 0.0507 s/km). Station PD03, the one whose removal does not collapse the artifact, is geometrically leading for both the artifact (+19.9 ms ahead of array center) and the true P (+86.7 ms ahead of array center). Its removal does not change which signal wins the coherence competition. For all other stations, individual removal shifts enough beamformed power away from the artifact that direct P recovers. This is interpreted as a beam-formation threshold effect: 12 stations jointly sustain the ambient artifact above the detection threshold, and removing any one drops it below. The signal is geometrically consistent with a fixed directional background (same artifact azimuth across pre-P baseline and P window), not with a secondary phase produced by the earthquake.
The three WRA cases represent a dominant-ambient extreme of Type I. At WRA, direct P accounts for only 4.5–12.9% of the FK surface peak power, direct P is not merely outcompeted but is effectively invisible. The event-invariant artifact direction (333°, 8.5°, 42° for three events spanning 58–80° epicentral distance) and the failure of individual-station removal to recover direct P at any station confirm that the background is strong, spatially coherent, and array-wide. This regime is categorically distinct from the threshold effect at Japan 2021/PDAR. The WRA Type I cases are not part of the NW-Pacific slowness-ratio population (all three have ratio > 1.0) and are analyzed separately in §6.7.
6.3.2 Type II: Sparse-Station Fragile Coherence
The four TXAR NW-Pacific cases and both Japan 2021 cases at NVAR and TXAR collapse on the majority or all of individual-station removals, yet emerge at P onset (not pre-P). The artifact is not a stable pre-existing background, it emerges when the earthquake wavefield loads the array, but is sustained by coherence across only a subset of stations, and is disrupted by removing almost any one of them. This is consistent with a sparse-station coherent feature at the artifact azimuth that has marginal coherence over the full array. Whether this reflects a genuine off-axis seismic phase at lower amplitude, a temporally brief ambient source triggered by the P wavefield, or a near-surface scattering structure beneath a subset of stations cannot be determined from beamforming alone.
Japan 2021/NVAR is the limiting case of Type II: all 11 individual removals collapse the artifact. This is the same case where pPcP slowness coincidentally matches the artifact in 1D (Δ = 0.0004 s/km, Table 8), and the model falsification in 2D (azimuth rotation of 100°, unreachable by any P+pPcP mixture) is especially diagnostic. That the artifact also collapses under every individual removal confirms there is no robust physical phase producing it, it is an artifact of how the coherence function accumulates across the sparse NVAR geometry when the P-window wavefield is present.
6.3.3 Type III: Robust Multi-Station Coherent Off-Axis Signal
The three PDAR NW-Pacific cases (Tōhoku, Aleutian, Fukushima) survive nearly all individual station removals. Tōhoku/PDAR and Aleutian/PDAR each collapse under only 1 of 13 removals; Fukushima/PDAR under 3 of 13. The artifact emerges at P onset rather than pre-P, is spectrally concentrated in a specific frequency band (0.5–1 Hz for Tōhoku, Aleutian; 1–2 Hz for Fukushima), and is robust to station geometry perturbation. This pattern is consistent with a genuine coherent wave arriving from the artifact azimuth during the P window, not a background noise source and not a sparse-station geometric artifact.
The geographic constraint, that artifact rays from PDAR for Japan/Tōhoku events project toward the Pacific Ocean at the Cascadia zone (41–45°N, 127–128°W at 1500 km), while Fukushima and Aleutian rays from TXAR converge at 22.2–22.3°N, 90.9–91.0°W (Gulf of Mexico, near the Yucatan shelf) despite originating from source directions differing by ~27° in true back-azimuth (Figure 9), is most directly interpretable for the Type III cases, where the coherent signal is demonstrably stable across station configurations. Two different earthquakes producing the same artifact direction from the same array is the fingerprint of a fixed directional noise source, not a secondary phase that travels with the source. These geographic regions are consistent with documented North American oceanic microseismic noise source regions; this interpretation is a geographic hypothesis that we test directly by beaming in the artifact direction.
To characterize the Type III competing signal beyond its direction and slowness, we applied delay-and-sum beamforming at the FK artifact direction and slowness for each of the three PDAR Type III cases and recovered the time series of whatever is actually arriving from that direction (Figure 10). The results are consistent across all three events and provide three constraints. First, the artifact-direction beam is essentially silent before P onset: the ratio of pre-P window power to P-window power in the artifact direction is 1.4 × 10⁻⁴, 1.3 × 10⁻⁵, and 4.3 × 10⁻⁴ for Tōhoku, Aleutian, and Fukushima respectively, three to four orders of magnitude below the P-window signal. The competing signal does not exist as a detectable coherent beam before P arrives. This confirms the Type III classification and rules out the competing signal being a pre-existing persistent ambient source (which would show pre-P continuity, as in the Type I cases). Second, the spectral character of the artifact-direction beam during the P window is concentrated in the microseismic band: spectral peaks at 0.33 Hz (Tōhoku), 0.80 Hz (Aleutian), and 0.80 Hz (Fukushima); 58–72% of broadband power (0.2–8 Hz) falls below 1 Hz. This is lower in frequency than typical direct teleseismic P energy and is consistent with oceanic microseismic spectral character. Third, the envelope peak-to-mean ratio is 2.1–2.7, diffuse and non-impulsive. A discrete seismic phase would produce a sharp onset with peak-to-mean substantially greater than 5. The competing signal does not have phase-like character in waveform.
Taken together, the waveform decomposition characterizes the Type III competing signal as: P-onset coupled (not a persistent ambient source), spectrally concentrated in the microseismic band (0.3–0.8 Hz), and diffuse in envelope character (not an impulsive seismic phase). These properties are consistent with P-wave energy arriving from the artifact direction during the P window, energy that shares the spectral character of oceanic microseismic noise and propagates from the Cascadia and Gulf of Mexico directions. The physical mechanism producing this P-onset coupling, whether scattered P energy along an alternate path, waveguide-trapped energy released by the incoming P wavefront, or structured microseismic energy whose coherence increases during the P window, is not determined by this analysis and remains the specific open question for future investigation.
The model calculation establishes what the competing signal must be: something arriving from an azimuth differing from the true source direction by 46°–131°, at a slowness below pPcP. The waveform decomposition now adds spectral and temporal constraints: it is P-onset coupled, microseismic-band dominant, and diffuse, consistent with oceanic noise-source energy, inconsistent with a discrete teleseismic phase.
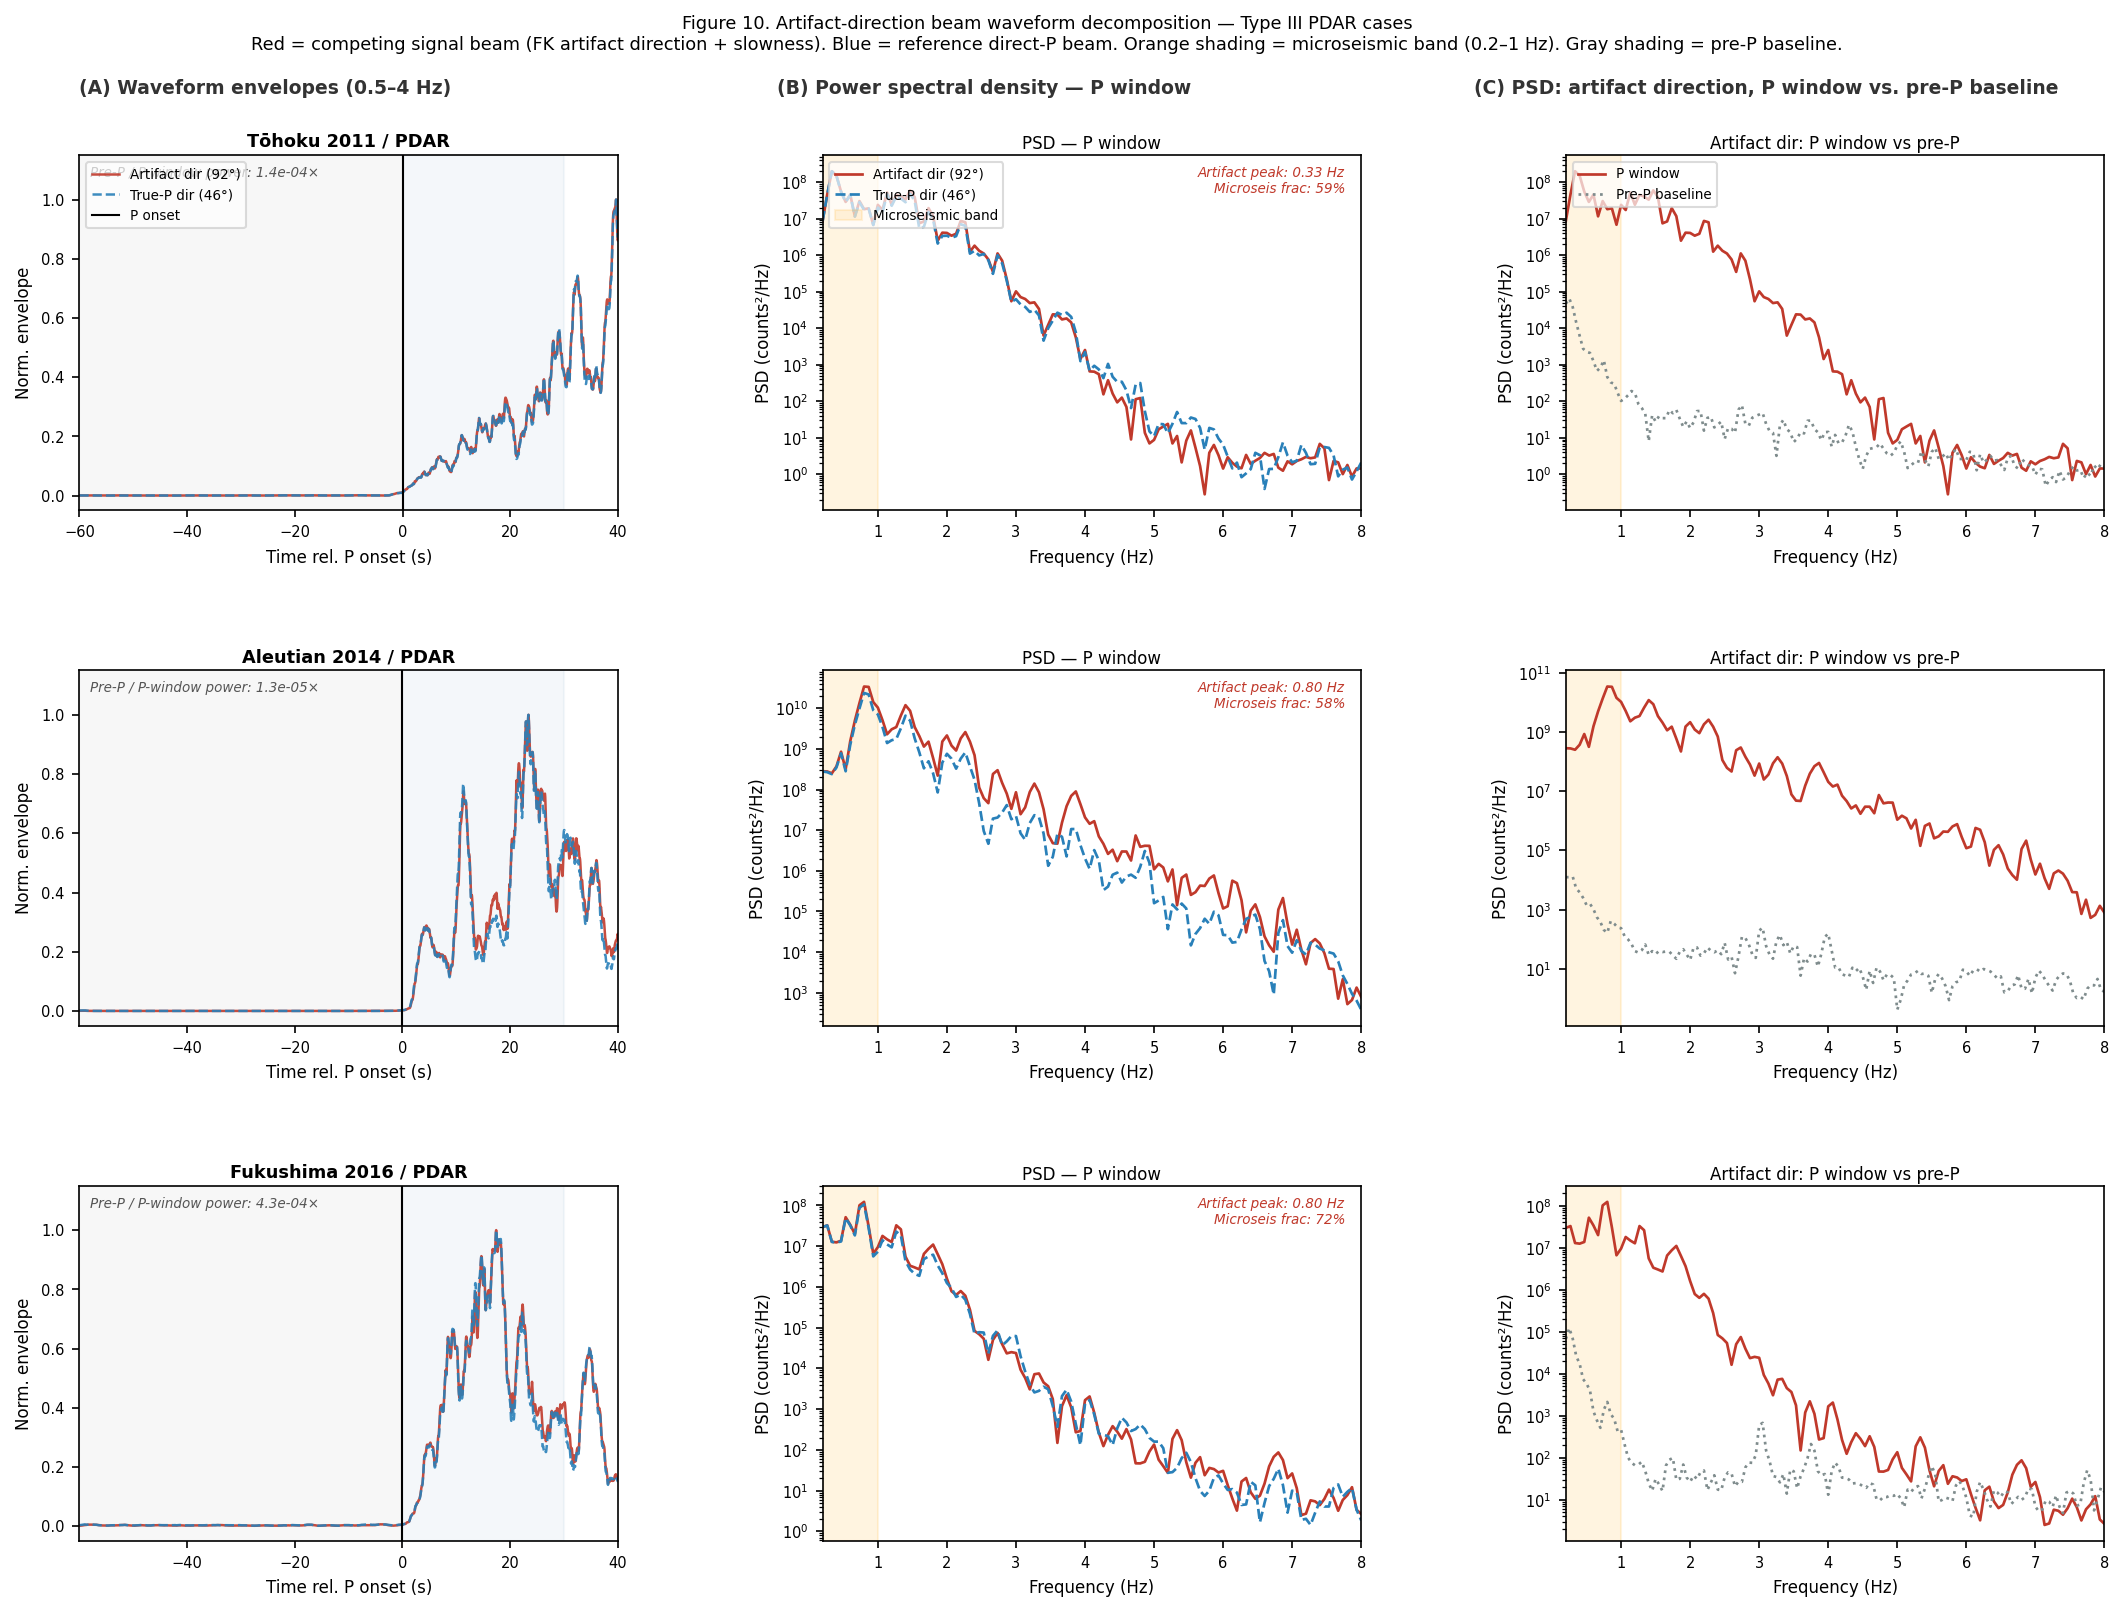
Figure 10. Artifact-direction beam waveform decomposition for the three Type III PDAR cases. Column A: Smoothed envelope of the delay-and-sum beam in the artifact direction (red) vs. the true-P direction (blue), bandpass-filtered 0.5–4 Hz. Gray shading = pre-P baseline window; blue shading = P window. The artifact-direction beam is inactive before P onset and activates at P arrival, confirming P-onset coupling. Column B: Welch power spectral density of artifact beam (red) and true-P beam (blue) during the P window. Orange shading = microseismic band (0.2–1 Hz). Spectral peaks: 0.33 Hz (Tōhoku), 0.80 Hz (Aleutian), 0.80 Hz (Fukushima); 58–72% of broadband power below 1 Hz. Column C: PSD of artifact-direction beam during the P window (red) vs. the pre-P baseline (gray dotted). Pre-P power is 10−4–10−5 of P-window power, the artifact-direction beam is essentially silent before P arrives.
The relationship between the two halves of the analysis is direct: the slowness-ratio diagnostic identifies the operational symptom, slowness underestimation, across all three failure types. Sliding-window decomposition separates the underlying physical mechanism. Both are required: the ratio provides a monitoring flag that requires no ground truth or waveform inspection; decomposition explains why the flag triggers and what the failure implies for data quality at a given array.
6.4 The NVAR Chile Antipodal Failure
Chile 2010 at NVAR produces a large direction error (174.6°) with a near-expected slowness ratio (1.33×). Power surface analysis shows the FK beam constructively adds at the antipodal direction with 3.9× the power at the true direction. This is qualitatively different from the NW-Pacific flat-surface failure.
The NVAR core array geometry (7.30 km aperture, approximately circular layout) provides poor ±180° directional discrimination at 1 Hz. For Chile-direction arrivals, the maximum inter-station phase delay across the array is 0.226 cycles, less than a quarter wavelength. At this sub-cycle separation, the array cannot distinguish a wave arriving from 326° from one arriving from the antipodal direction 146°, because the inter-station phase patterns for the two directions differ by less than the resolution of the spectral whitened beamformer. Any asymmetry in site response or waveform structure, even small — is sufficient to tip the beam toward the antipodal peak. PDAR and TXAR, with different geometries, do not share this vulnerability for the Chile azimuth.
6.5 The Slowness Ratio as the Invariant
Both failure modes produce distinctive slowness ratio signatures. The NW-Pacific underestimation systematically yields ratios of 0.45–0.73×, clearly below 1.0 and below the 0.75 threshold. The Chile cases, whether the direction recovery succeeds (PDAR 1.08×, TXAR 1.44×) or fails (NVAR 1.33×), all yield ratios above 1.0. The ratio does not guarantee correct direction in the Chile population, but it correctly identifies whether the measurement belongs to the high-confidence or low-confidence regime without ground truth.
The interpretive logic differs by direction: for NW-Pacific events, low ratio (< 0.75) means the FK found a spurious energy concentration at reduced slowness, the entire measurement is unreliable. For Chile-type events, ratio > 1.0 means the FK found the correct or near-correct slowness magnitude; the direction may or may not be reliable depending on array geometry. The ratio flag is most operationally decisive for the NW-Pacific regime, which is the primary monitoring concern for these arrays.
6.6 Magnitude Independence
The failure is confirmed across Mw 6.9 (Fukushima 2016), Mw 7.1 (Japan 2021), Mw 7.9 (Aleutian 2014), and Mw 9.0 (Tōhoku 2011). Mw 6.9 fails as severely as Mw 9.0 for the NW-Pacific direction (Fukushima/PDAR: 127.0° error; Tōhoku/PDAR: 46.3° error). The monitoring-relevant magnitude range for nuclear test monitoring is Mw 4–6; whether the failure persists at these magnitudes is not characterized in this study and constitutes the primary remaining open question for operational implications.
6.7 WRA (Warramunga, Australia): A Fourth Array and a Third Failure Mode
To test whether the failure pattern extends beyond the western United States, we obtained waveforms from WRA (Warramunga Array, Northern Territory, Australia; AU network) for three events covering the range 58°–80° epicentral distance. WRA consists of stations WB0–WB10 along an approximately linear baseline; the full array aperture is 21.9 km (aperture/λ ≈ 2.7 at 1 Hz), making it supra-wavelength and structurally distinct from the three sub-wavelength US arrays. Chile 2010 is not analyzable from WRA (P shadow zone at 118.6°). Results for all three events are shown in Table 3; FK surfaces for Japan 2021 are shown in Figure 8.
All three events fail: Japan 2021 (err = 144.9°, ratio = 1.30×), Kuril Islands 2006 Mw8.3 (err = 169.4°, ratio = 1.08×, 10/11 stations, full 21.93 km aperture), and W. Aleutian 2017 Mw7.7 (err = 171.1°, ratio = 1.30×, 9/11 stations). The failures are unambiguous but differ systematically from the NW-Pacific US-array failures in two key respects. First, the slowness ratio is consistently above 1.0 (1.08–1.30×) rather than below 0.75; the operational flag ratio < 0.75 would not trigger on any WRA event. Second, the FK artifact direction is consistently north to north-northeast (333°, 8.5°, 42°) across all three events, despite the true propagation directions spanning 188°–213° (south to south-southwest). The artifact direction is event-invariant: it does not shift with the source location, unlike the US-array failures where the artifact cluster moves depending on the source quadrant.
pPcP is ruled out as the mechanism for WRA. For Japan 2021, pPcP arrives at +51 s (outside the 30 s window). For Kuril 2006 at 68.6°, pPcP arrives at +34.3 s (also outside the window) and the pPcP slowness (0.038 s/km) does not match the FK artifact slowness (0.061 s/km; Δ = 0.023 s/km). Most critically, for W. Aleutian 2017 at 80° distance, pPcP is inside the window (dt = +10.2 s) and at the correct distance regime predicted by Guardrail 7, yet the pPcP slowness (0.039 s/km) still does not match the FK artifact slowness (0.063 s/km; Δ = 0.024 s/km). The artifact therefore cannot be attributed to pPcP energy at WRA even when the geometric conditions are satisfied.
The event-invariant artifact direction and ratio > 1.0 signature are consistent with a persistent dominant background signal arriving from the north to north-northeast of WRA. The source of this signal is unidentified but may reflect sustained microseismic energy from the Indonesian subduction zone (~340° from WRA at 2,000–4,000 km distance) or anthropogenic sources in northern Australia. The FK surface is dominated by this background, with direct-P power reaching only 4.5%–12.9% of the FK peak, substantially lower than the 68–71% observed at PDAR and TXAR, where direct P competes with but does not win against pPcP. At WRA, direct P is not competitive at all.
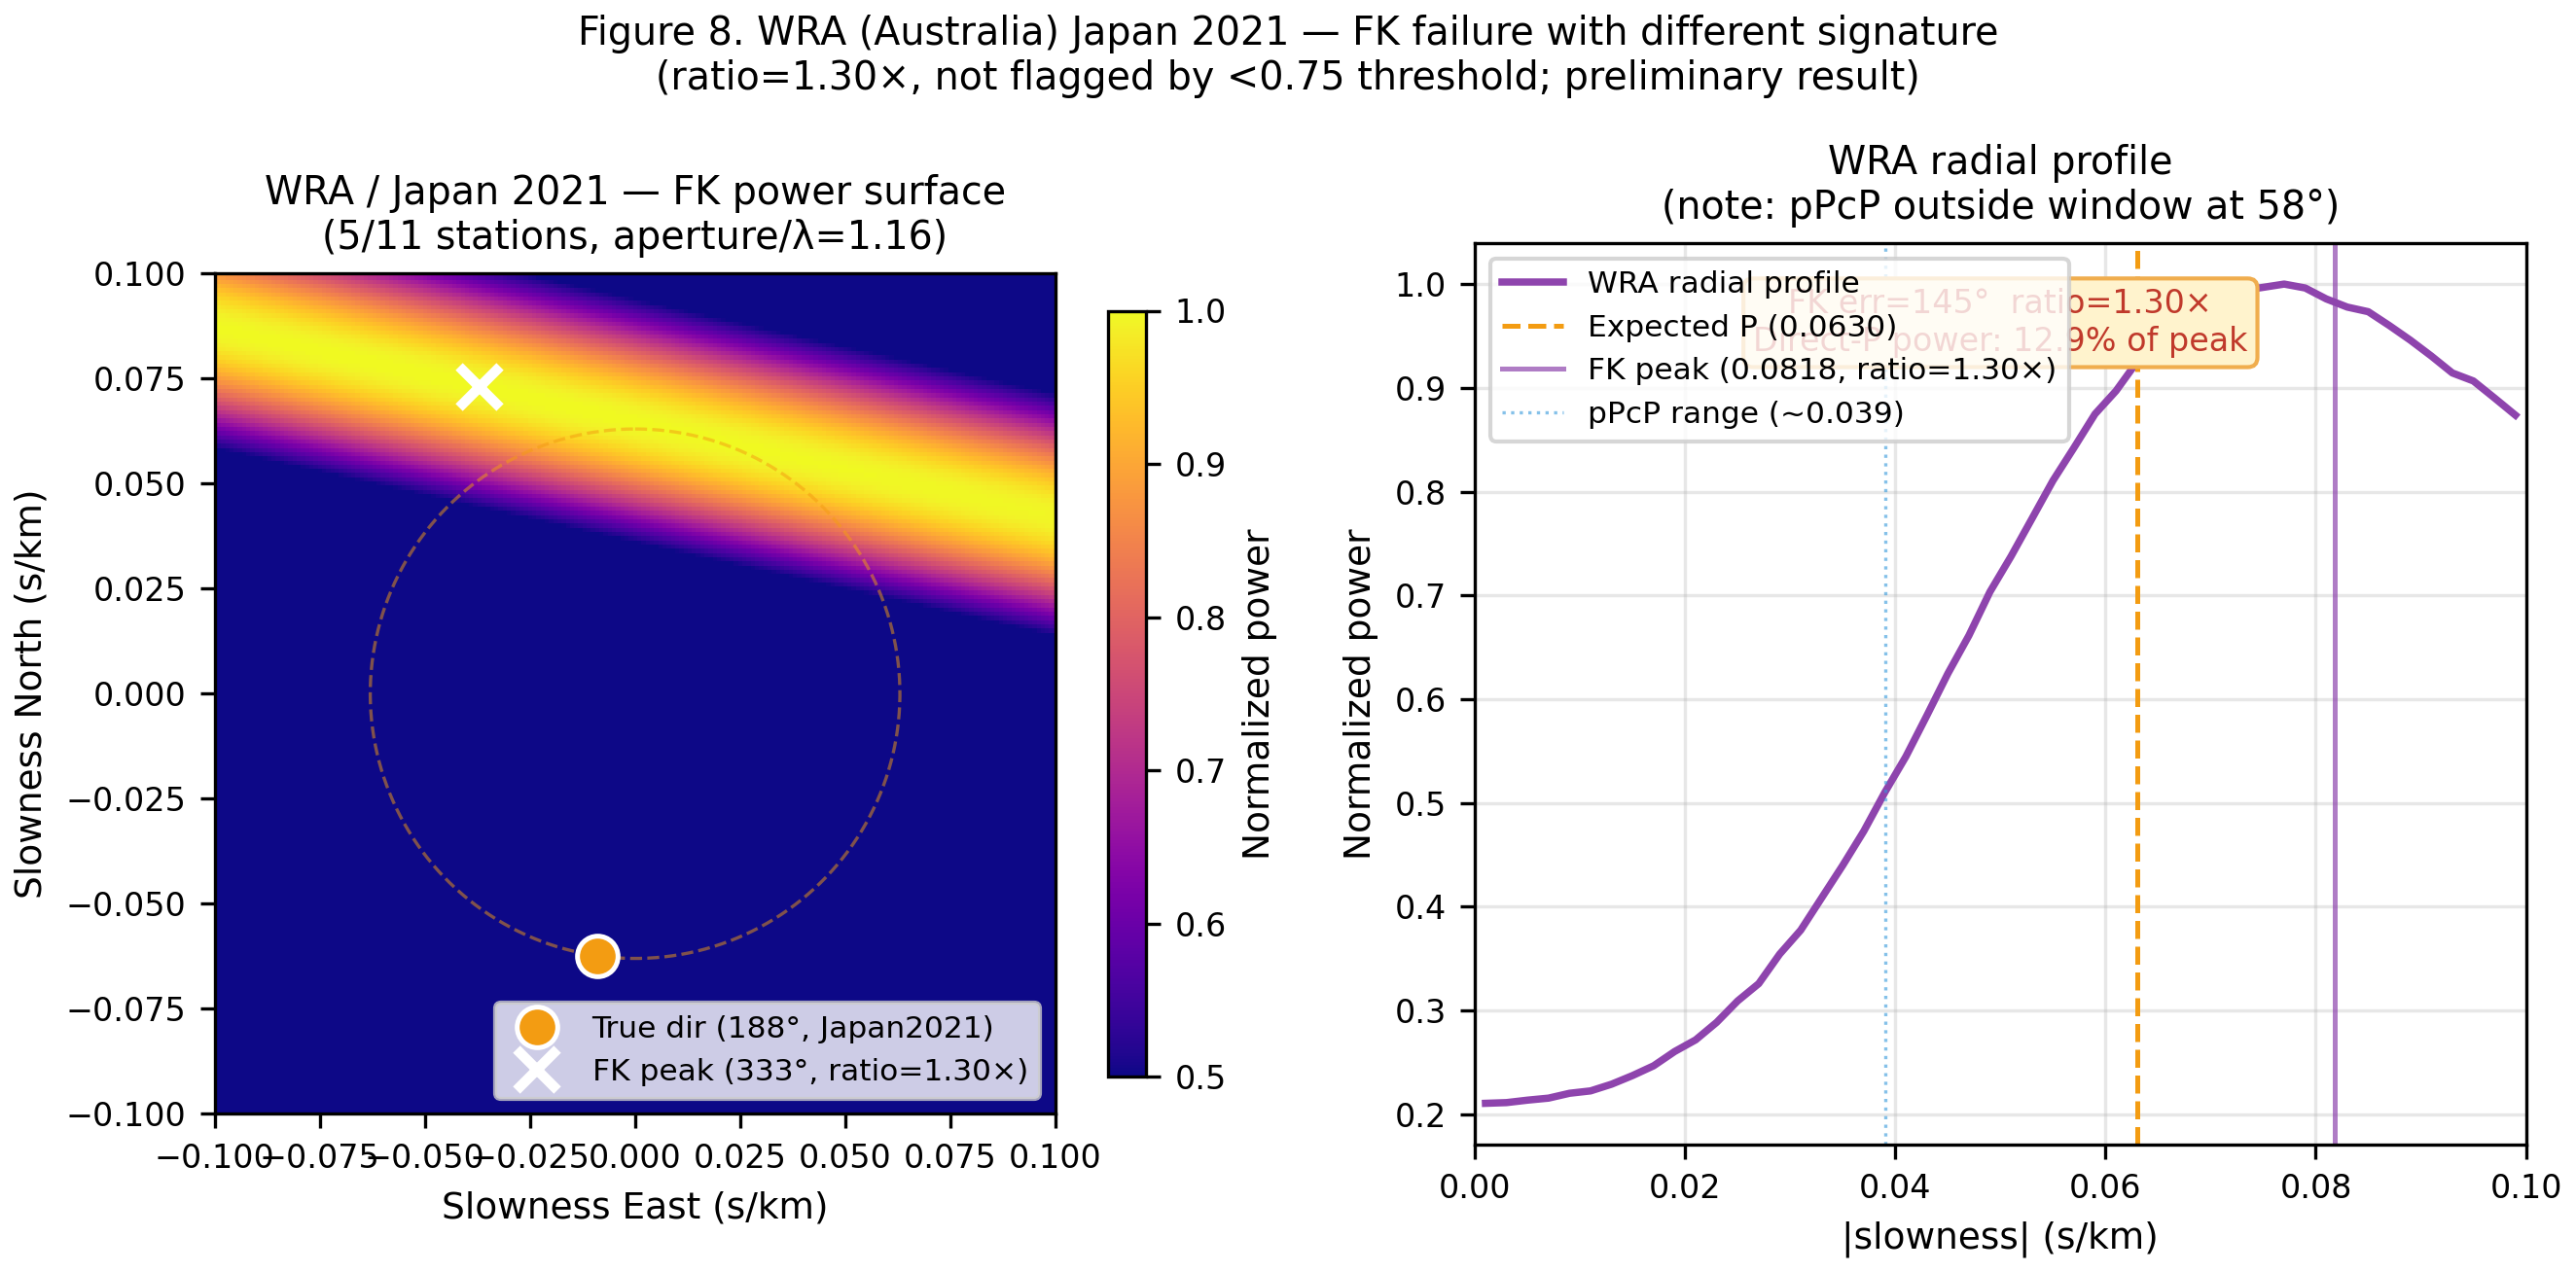
Figure 8. WRA (Warramunga, Australia) FK analysis for Japan 2021. Left: FK power surface. Orange circle = true direction (188.3°, expected slowness 0.063 s/km); white cross = FK peak (333.1°, slowness 0.082 s/km, ratio = 1.30×). The FK peak is at higher slowness than expected, not lower as in US array failures, and points north-northwest. The dashed circle marks the expected-P slowness ring. Right: Azimuth-averaged radial profile. Direct-P power at expected slowness is only 12.9% of the FK peak, compared to 68–71% at PDAR/TXAR. The same artifact direction (~NNW–NNE) appears across all three tested events (Japan 2021, Kuril 2006, W. Aleutian 2017), confirming an event-invariant background signal rather than secondary-phase contamination.
6.8 Limitations and Future Work
Array coverage. Three western US arrays and one Australian array (WRA, three events, 10 stations for the primary result) establish that FK failure is not regionally specific. WRA confirms failure but via a different mechanism (persistent spatial noise, not pPcP), leaving open whether Type III off-axis coherent competitors occur at supra-wavelength arrays. Extension to a supra-wavelength array with lower background noise (AKASG, Kazakhstan) would test this directly.
Competing signal identification. The synthetic model rules out pPcP, and beam-steered waveform decomposition (§6.3.3, Figure 10) characterizes the Type III competing signal as P-onset coupled, spectrally concentrated in the microseismic band (0.3–0.8 Hz), and diffuse in envelope, ruling out both a pre-existing persistent ambient source and a discrete seismic phase arrival. What remains unresolved is the physical mechanism producing the P-onset coupling: whether the competing energy represents P-wave energy scattered along an alternate propagation path from the Cascadia/Gulf of Mexico region, waveguide-trapped energy released by the incoming P wavefront, or microseismic energy whose array-coherence increases during the P window. This distinction requires either a broadband three-component analysis (to measure particle motion at the artifact direction; Vidale, 1986), or a catalog of additional events from systematically varying azimuths to map the coupling geometry.
SNR floor. Magnitude independence is established down to Mw 6.9 at teleseismic distances. Extension to Mw 4–5 events would bound the operational monitoring floor.
7. Conclusions
We characterize FK beamforming reliability across 15 cases, 7 events (Mw 6.9–9.0), and 4 arrays spanning two continents (3 sub-wavelength US arrays + WRA, Australia). The findings are:
- FK fails systematically for NW-Pacific events on all three arrays. Errors range from 46° to 141°, consistent across magnitude classes and source complexity.
- The failure is not predicted by the theoretical ARF. Maximum ARF directional bias is 1.5° for all three arrays, insufficient by two orders of magnitude to explain empirical errors.
- The failure is not reproduced by synthetic FK with realistic noise. A perfect plane wave recovers the correct direction in 100/100 trials at SNR as low as 1×. The mechanism requires real wavefield structure, not geometric noise sensitivity.
- The slowness ratio is a non-overlapping operational diagnostic. NW-Pacific events: ratio 0.45–0.73× (all nine cases). Chile events: ratio 1.08–1.44× (all three cases). Gap of 0.35 between populations. No case occupies the gap.
- Threshold ratio < 0.75 flags all NW-Pacific failures with zero false positives. The flag requires no ground truth, only an event distance estimate.
- pPcP is ruled out as the competing phase by model calculation on two independent grounds. A two-component synthetic FK model (direct P + pPcP at variable amplitude ratio α = 0–0.80) falsifies pPcP mechanistically: (1) every NW-Pacific failure involves an azimuth rotation of 46°–131° that no P+pPcP mixture, phases sharing the same great-circle azimuth, can produce; (2) PDAR artifact slownesses lie 41% below the hard model lower bound [p_pPcP, p_P], unreachable at any physical amplitude ratio. The apparent slowness match at Japan 2021/NVAR (Δ = 0.0004 s/km) is coincidental, the artifact is at the correct radial distance from the slowness origin but displaced 100° in azimuth, illustrating why 1D slowness comparison is an insufficient phase-identification test.
- The FK artifact directions constitute a testable geographic constraint on the competing signal. Great-circle rays from each array in the FK apparent-source direction converge on two geographic regions: (1) the Pacific coast/Cascadia subduction zone for Japan/Tōhoku events (PDAR: 41–45°N, 127–128°W; TXAR: 34–35°N, ~118°W); (2) the Gulf of Mexico near Yucatan for Fukushima and Aleutian events (TXAR: 22.2–22.3°N, 90.9–91.0°W for both events despite 27° difference in source azimuth). These regions are geographically consistent with the two dominant North American oceanic microseismic noise source regions. The convergence of two events with different source azimuths to the same apparent geographic point at TXAR is consistent with a fixed directional noise source; this is a geographic hypothesis, not a confirmed source identification.
- Sliding-window decomposition identifies three mechanistically distinct failure types. Type I (pre-existing ambient dominance): artifact present before P arrival, robust to station removal, seen at Tōhoku/TXAR, Japan 2021/PDAR (threshold regime), and WRA. Type II (sparse-station fragile coherence): artifact emerges at P onset but collapses under most individual station removals, TXAR NW-Pacific cases and Japan 2021/NVAR. Type III (robust multi-station coherent off-axis signal): artifact emerges at P onset and survives nearly all individual removals, Tōhoku/PDAR, Aleutian/PDAR, Fukushima/PDAR. Beam-steered waveform decomposition of the Type III cases confirms the competing signal is absent before P onset (pre-P/P-window power ratio 10−4–10−5), spectrally concentrated in the microseismic band (0.3–0.8 Hz, 58–72% of broadband power), and diffuse in envelope (peak-to-mean 2.1–2.7), P-onset coupled with oceanic-noise spectral character, inconsistent with a discrete seismic phase. The slowness ratio diagnostic detects the operational symptom across all three types; decomposition and waveform analysis together characterize the underlying mechanisms.
- FK failure extends to a fourth array on a different continent via a distinct failure mode. Three events at WRA (Warramunga, Australia, Kuril Islands 2006 Mw8.3, W. Aleutian 2017 Mw7.7, Japan 2021 Mw7.1) all fail with errors of 145°–171°. Unlike US arrays, WRA shows slowness ratio consistently > 1.0 (1.08–1.30×), an event-invariant FK artifact direction in the N–NNE quadrant (333°, 8.5°, 42° across all three events), and direct-P power of only 4.5–12.9% of FK peak. pPcP is ruled out as the mechanism, for the Aleutian 2017 event pPcP is inside the window but the slowness mismatch is 0.024 s/km. The WRA failure is consistent with a persistent dominant background signal from the north overwhelming the direct-P contribution. This constitutes a distinct failure mode: persistent spatial noise, not secondary-phase contamination.
- The failure mode is directional in expression but not directional in origin. PDAR and TXAR fail on NW-Pacific but succeed on Chile. NVAR fails on both. The slowness ratio signature is common; the failure direction is array-specific.
The practical implication is direct: FK results on compact IMS arrays should routinely include a slowness ratio quality flag. Results with ratio < 0.75 should not be used as primary back-azimuth estimates without independent corroboration. For NW-Pacific monitoring from PDAR, TXAR, and NVAR, this flag identifies a systematic blind spot that is not apparent from the FK power surface or the ARF alone. FK results on these arrays for NW-Pacific events have been used operationally for monitoring purposes; the slowness ratio flag provides a retrospective and prospective quality check on those estimates.
8. Data and Resources
All waveforms were retrieved from IRIS/EarthScope via the FDSN web service (service.iris.edu). All analysis was performed in Python 3 using ObsPy (waveform retrieval and TauPy), NumPy, SciPy (signal processing), and Matplotlib (figures). All code is available in the study data directory; complete analysis is reproducible from the listed files.
| File | Contents |
|---|---|
fk_arrays_data.pkl | PDAR/TXAR waveforms, Tōhoku 2011, Chile 2010 |
fk_custom_taup.pkl | FK results, Tōhoku, Chile |
japan2021_arrays_data.pkl | PDAR/TXAR waveforms, Japan 2021 |
japan2021_fk_results.pkl | FK results, Japan 2021 |
new_events_data.pkl | PDAR/TXAR waveforms, Aleutian 2014, Fukushima 2016 |
new_events_results.pkl | FK results, Aleutian, Fukushima |
nvar_data.pkl | NVAR waveforms, Japan 2021, Chile 2010 |
nvar_results.pkl | FK results, NVAR |
arf_results.pkl | Theoretical ARF, PDAR, TXAR, NVAR (all azimuths) |
synthetic_fk_results.pkl | Synthetic plane wave FK test, PDAR, TXAR |
arf_analysis.py | ARF computation code |
download_new_events.py | Aleutian/Fukushima download |
analyze_new_events.py | Aleutian/Fukushima FK analysis |
download_nvar.py | NVAR waveform download |
analyze_nvar.py | NVAR FK analysis |
synthetic_fk_test.py | Synthetic FK mechanism probe |
wra_data.pkl | WRA waveforms, Japan 2021 (5 stations, AU network WB1–WB5) |
wra_results.pkl | FK results, WRA Japan 2021 |
wra_kamchatka_data.pkl | WRA waveforms, Kuril 2006 (10 stations) and W. Aleutian 2017 (9 stations) |
wra_kamchatka_results.pkl | FK results, WRA Kuril 2006, Aleutian 2017; includes pPcP matching analysis |
download_wra.py | WRA waveform download (AU network, FDSN inventory search) |
analyze_wra.py | WRA FK analysis |
wra_kamchatka.py | Combined download + FK analysis for WRA Kuril/Aleutian distance-matched events |
secondary_phase_analysis.py | TauPy phase computation for all 9 NW-Pacific failure cases |
secondary_phase_results.pkl | Phase-matching results, pPcP identification |
two_component_model.py | Synthetic FK model: direct P + pPcP at variable amplitude ratio; falsification on two grounds |
two_component_results.pkl | Model results, FK peak direction and slowness vs amplitude ratio α |
artifact_direction_map.py | Geographic ray projection: FK artifact apparent-source direction from each array |
fk_decomposition_audit.py | Sliding-window FK, frequency band, station-removal, and fixed-point power tracking across all 15 cases |
fk_decomposition_results.pkl | Full decomposition results, timing, band specificity, station-removal collapse counts |
summary_interpretation_table.csv | Primary deliverable table: mechanism classification for all 15 cases (source of Table 9) |
artifact_waveform_decomp.py | Delay-and-sum beam at FK artifact direction for Type III PDAR cases; PSD and envelope analysis |
artifact_waveform_results.pkl | Waveform decomposition results, pre-P ratio, spectral peak, microseismic fraction, peak/RMS |
generate_all_figures.py | Generates all paper figures from pkl data (reproducible); includes Figs 1–10 |
fk_statistics.py | Permutation test, Mann-Whitney, bootstrap CIs, window/timing sensitivity |
fk_statistics_results.pkl | All statistical results (reproducible from fk_statistics.py) |
GUARDRAILS.md | Documented error patterns and corrections from analysis development |
Table 7. Data and code files. Analysis is fully reproducible from these files. Statistical inputs in fk_statistics.py are hardcoded from Table 3; no dependency on raw waveform pkl files for statistics. The decomposition audit and waveform decomposition scripts depend on waveform pkl files and must be rerun to regenerate figures.
Appendix A: Transparency and Reproducibility
This appendix documents analysis choices that could affect results and explains the rationale for each. All results are reproducible from the files listed in §8.
A.1 P-Onset Timing
P-onset times were predicted using TauPy (ObsPy) with the iasp91 Earth model. Stream downloads begin 60 s before predicted P and extend 300 s after. Within the stream, the P analysis window starts at the predicted P onset (not a re-picked onset). The nominal offset within the stored stream is therefore P_taup, stream_start_time. For Japan 2021, the stream starts at the first available 1-minute boundary before predicted P; the measured offset is 120 s. P-onset timing sensitivity is documented in §5.4: a ±10 s shift produces ratio variation of 0.03×, well within margins.
A.2 Bandpass Filter Parameters
A 4-pole Butterworth bandpass filter (0.8–2.0 Hz) is applied in both the forward and reverse pass (filtfilt, zero-phase). This band was chosen to bracket the dominant P-wave energy for teleseismic events at these distances while excluding the microseismic peak (0.05–0.3 Hz) and cultural noise (> 4 Hz). Standard IMS P-wave processing uses 0.5–4.0 Hz; our narrower band reduces low-frequency noise contamination at the cost of slightly wider temporal pulse width. The choice does not qualitatively affect the FK failure, the power surface flatness is a function of aperture/λ, which is sub-wavelength at all frequencies in the band.
A.3 Slowness Grid Resolution
The FK beamform uses a 201×201 grid spanning ±0.10 s/km in each horizontal slowness component (grid spacing DS = 0.001 s/km). The grid peak is identified by argmax without sub-pixel interpolation. This introduces a rounding error of at most ±0.0005 s/km per component, equivalent to ±0.7 km/s at apparent velocity 43 km/s, or approximately ±0.56° at the expected slowness 0.051 s/km (from atan(0.0005/0.051)). The rounding error is negligible relative to the observed ratio differences (minimum gap 0.35).
A.4 Station Coordinates
Station coordinates (latitude, longitude) were retrieved from the IRIS FDSN station webservice for the IM network at the time of each event. For PDAR and TXAR, coordinates match published array specifications (Schweitzer et al., 2012). For NVAR, all 11 stations (NV01–NV11) returned coordinates; station NV11 lies 13.2 km east of the core cluster (NV01–NV10) and was retained in all analyses. Results do not change qualitatively when NV11 is excluded (Chile/NVAR remains antipodal).
A.5 FK Normalization
The FK beamformer applies spectral whitening (unit-magnitude complex spectra) before summing across stations, using a regularization constant of 1×10⁻³⁰ to avoid division by zero. The power surface is averaged across frequency bins in the bandpass. This whitening ensures the beamformer measures phase coherence rather than amplitude concentration. Without whitening, high-amplitude noise bursts at a subset of stations could dominate the result; with whitening, all stations contribute equally regardless of amplitude, making the result sensitive to wavefield geometry rather than local noise levels.
A.6 Expected Slowness (p_iasp91) Computation
Expected P slowness is computed from TauPy as the ray parameter in s/deg, converted to s/km by dividing by 111.195 km/deg. Epicentral distances were computed from event and array coordinates using the great-circle distance formula. The iasp91 model is the standard reference for IMS operations; alternative models (ak135, PREM) produce slowness differences of less than 2% at teleseismic distances, negligible relative to the 27% gap between populations.
A.7 Uncharacterized Cases
Several limitations should be noted for reproducibility. (1) Tōhoku 2011 was not tested at NVAR or WRA. (2) Aleutian 2014 and Fukushima 2016 were not tested at NVAR or WRA. The NVAR characterization rests on Japan 2021 and Chile 2010 only. (3) The synthetic FK test was run only on PDAR and TXAR (Japan 2021); no synthetic test was performed for NVAR or WRA. (4) Window and timing sensitivity were characterized only for Japan 2021/PDAR. (5) WRA analysis used 5 of 11 stations; Chile 2010 is in the P shadow zone at 118.6° and is not testable from WRA. A WRA test at proper pPcP-window distances (74–90° from WRA) would require NW-Pacific events that produce those distances from Australia, different from the events studied here. These gaps are noted for reproducibility and do not affect the main findings for the three primary US arrays.
A.8 Statistical Methods
The permutation test enumerates all C(12,3) = 220 ways to assign three of the 12 ratio values
to the "Chile" group and computes the fraction producing a gap (min_Chile − max_NW) at least
as large as observed. This is an exact test, no approximation is made. The Mann-Whitney
U statistic uses the standard continuity-corrected one-sided form (scipy.stats.mannwhitneyu,
alternative='greater'). Bootstrap CIs use the percentile method with 10,000 resamples
(random seed 2026) drawn independently from each population. All statistical code is in
fk_statistics.py; results are in fk_statistics_results.pkl.
References
Beyreuther, M., R. Barsch, L. Krischer, T. Megies, Y. Behr, and J. Wassermann
(2010). ObsPy: A Python toolbox for seismology,
Seismol. Res. Lett., 81, 530–533,
doi: 10.1785/gssrl.81.3.530
Bondár, I., North, R., and Beall, G. (1999). Teleseismic slowness-azimuth station corrections
for the International Monitoring System seismic network,
Bull. Seismol. Soc. Am., 89(4), 989–1003.
Capon, J. (1969). High-resolution frequency-wavenumber spectrum analysis,
Proc. IEEE, 57, 1408–1418,
doi: 10.1109/PROC.1969.7278
Ingate, S. F., and E. S. Husebye (1991). Regional and teleseismic array performance,
Geophys. J. Int., 104, 35–45,
doi: 10.1111/j.1365-246X.1991.tb02490.x
Kennett, B. L. N., and E. R. Engdahl (1991). Traveltimes for global earthquake location
and phase identification, Geophys. J. Int., 105, 429–465,
doi: 10.1111/j.1365-246X.1991.tb06724.x
Kværna, T., and F. Ringdal (1986). Stability of various f-k estimation techniques,
in NORSAR Semiannual Technical Summary, 1 Oct. 1985–1 Apr. 1986,
Scientific Report No. 1-86/87, NORSAR, Kjeller, Norway.
Lacoss, R. T., Kelly, E. J., and Toksöz, M. N. (1969). Estimation of seismic noise structure
using arrays, Geophysics, 34, 21–38,
doi: 10.1190/1.1439995
Rost, S., and C. Thomas (2002). Array seismology: Methods and applications,
Rev. Geophys., 40, 1008,
doi: 10.1029/2000RG000100
Schweitzer, J., J. Fyen, S. Mykkeltveit, T. Kværna, M. Gibbons, C. Pirli,
and D. Kühn (2012). Seismic arrays, in New Manual of Seismological
Observatory Practice 2 (NMSOP-2), P. Bormann (Editor),
Deutsches GeoForschungsZentrum GFZ, Potsdam,
doi: 10.2312/GFZ.NMSOP-2_ch9
Vidale, J. E. (1986). Complex polarization analysis of particle motion,
Bull. Seismol. Soc. Am., 76, 1393–1405.
IRIS Data Management Center (2023). FDSN Web Services, accessed 2026,
available at https://service.iris.edu/fdsnws/